How to Work with the Data
Spanning multiple continents and theaters of war, the US Army's attitude research program was a novel, complex, ambitious undertaking, run by a small group of psychologists and social scientists working under unremitting pressure. The data they collected in the course of administering over 200 studies have undergone four imperfect transformations on the journey to this open-access website: from paper questionnaires to punch cards and film, then to computer tape and machine-readable documentation, then to multi-formatted electronic files, and finally to the forms available to you now.
Every effort has been made to be render the army's surviving World War II survey data as faithfully as possible with the resources available. The following guide is intended for scholars and other site visitors who wish to explore and analyze the data in greater depth, and to better understand the nuances and complexities of the collection from its original wartime production to where it presently stands.
Survey Details
Survey details appearing at the top of survey pages have been compiled from three primary sources:
- Machine-readable frequencies and documentation, i.e., codebooks, created in 1978 by the Roper Center for Public Opinion Research (Roper) in the process of transferring punch card data to computer tape.
- Research Branch documentation that accompanied computer tapes during their deposition at the U.S. National Archives and Records Administration (NARA).
- Additional archived paper records of the Research Branch accessioned by NARA in 1962, and of other related War Department agencies, also available at NARA.

Click "Show All Survey Details" on a survey's main page to see all available information (metadata) about a survey.
The information from these sources has been minimally edited, mainly to correct spelling errors, errors in punctuation, inaccurate place names, and similarly minor inconsistencies. Spelling and nomenclatures have not been modernized, nor have the names of army installations been updated.
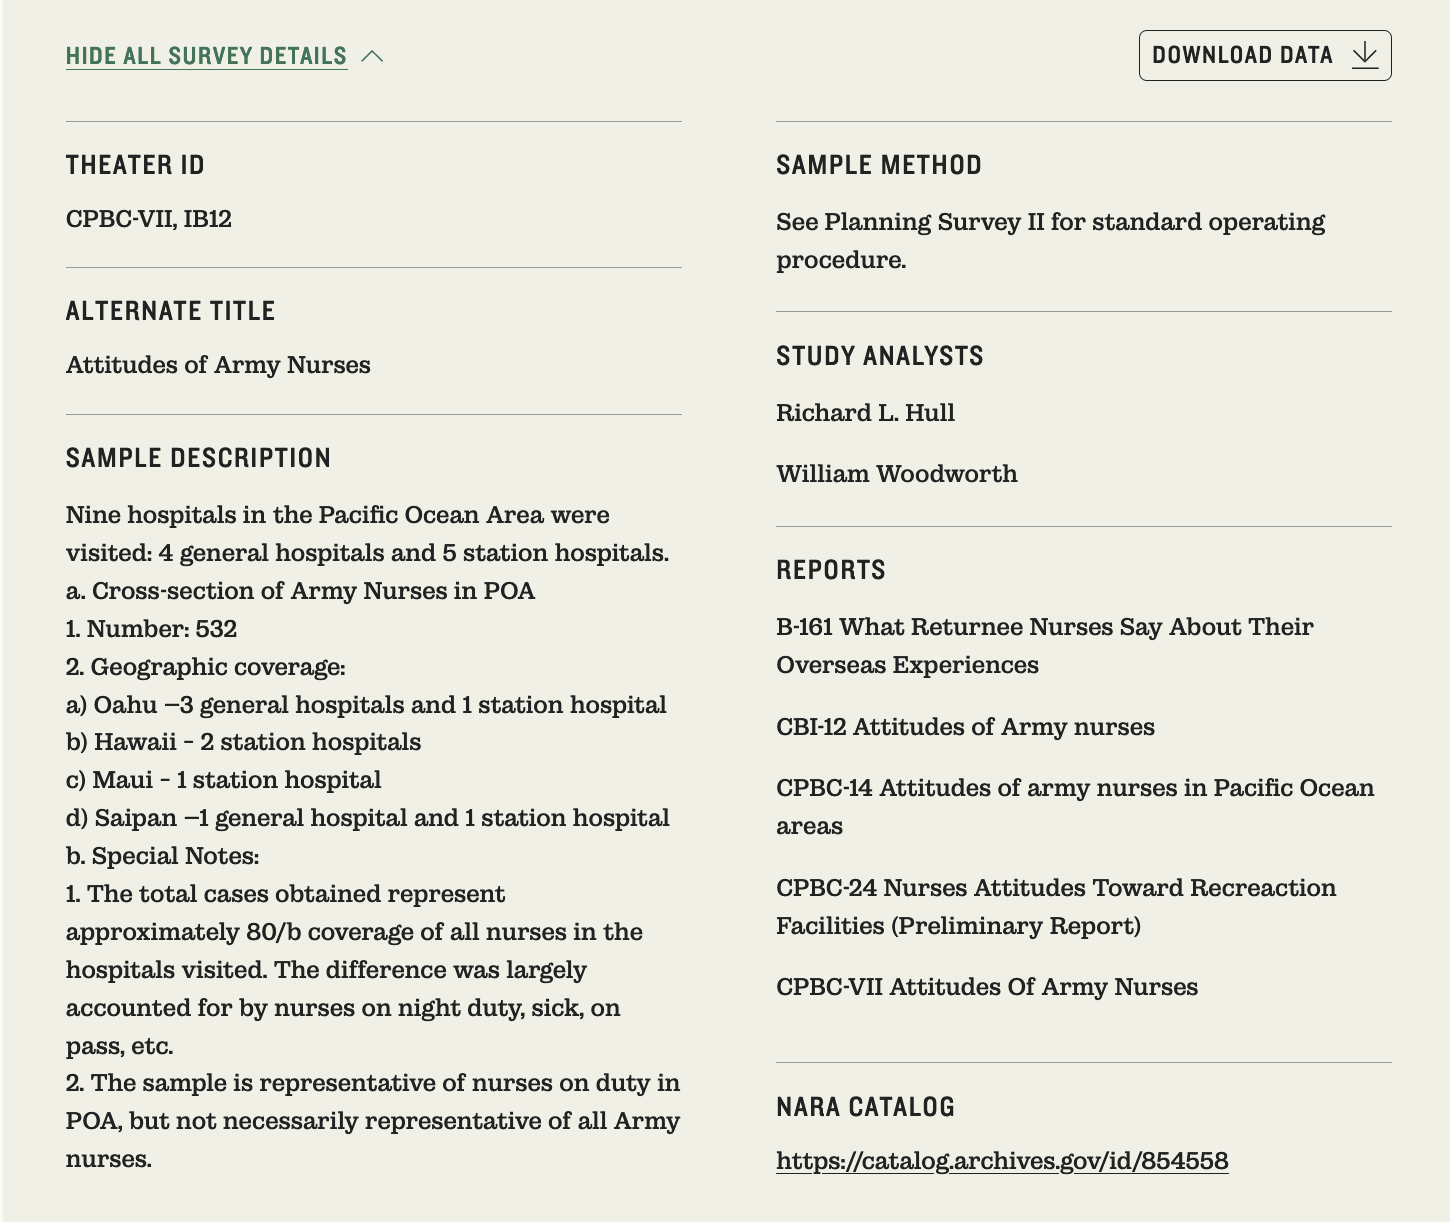
Here is an example of Survey Details for S-192, Nurses' Survey. Note that Sample Description may contain information about sampling methods as well as other study information.
Also, Location Details are often incomplete and only account for locations mentioned in codebooks or archived Research Branch records. Often, location details are missing or are incomplete for studies conducted overseas, like this one.
Types and Formats of Data
You may download two kinds of datasets depending on their availability: quantitative datasets consisting mostly of multiple-choice questions, and qualitative data derived from open-ended responses. The former is available at the survey level, with datasets containing all responses that survey participants provided, while the latter is available at the individual respondent level. (Note that the number of free responses rarely, if ever, matches the total sample size, as not every soldier wrote a response.)

A download data button will appear on survey pages only when quantitative datasets with multiple-choice questions and answers are available. If the button does not appear on the main page of a survey, only free responses exist.
Quantitative Datasets
Compressed, survey-level folders contain:
- Study information in the form of a codebook;
- An SPSS file in SAV format;
- Raw data in CSV format, accompanied by question (and variable) and answer labels in TXT format;
- A set of frequencies for each variable showing how many soldiers and what percentage of soldiers responded in each of the possible response categories for survey items.
A compressed survey folder may incorporate data for more than one questionnaire if more than one was used during administration and if data are available.
Both SPSS and raw data files should be considered "beta" versions only. Variables have not been reworded or edited unless necessary, nor new labels added. Nor has any attempt been made, at this time, to standardize labels for recurring variables, such as rank and education.
Links in Survey Details to the NARA Catalog will allow users to view original raw data files in ASCII, codebook(s) in plaintext, and technical documentation in PDF for all quantitative datasets.
Qualitative Data
Compressed, respondent-level folders contain:
- JPEG scans of the microfilmed free response at 400DPI resolution; and
- Text transcriptions of the free response in three formats: PDF, TXT, and JSON.
Transcription files have closed-question (multiple-choice) responses if they appear on the scanned image, along with Research Branch codes, tags applied by transcribers, and other metadata.
Codebooks
Survey codebooks created by Roper provide basic information about the data. This includes characteristics of the survey, how the data were collected, the text of each question, the possible responses for each "closed" question, the quantitative codes for each response, response frequencies, and where each datum was punched on the original punch card(s).
Characteristics of the Survey
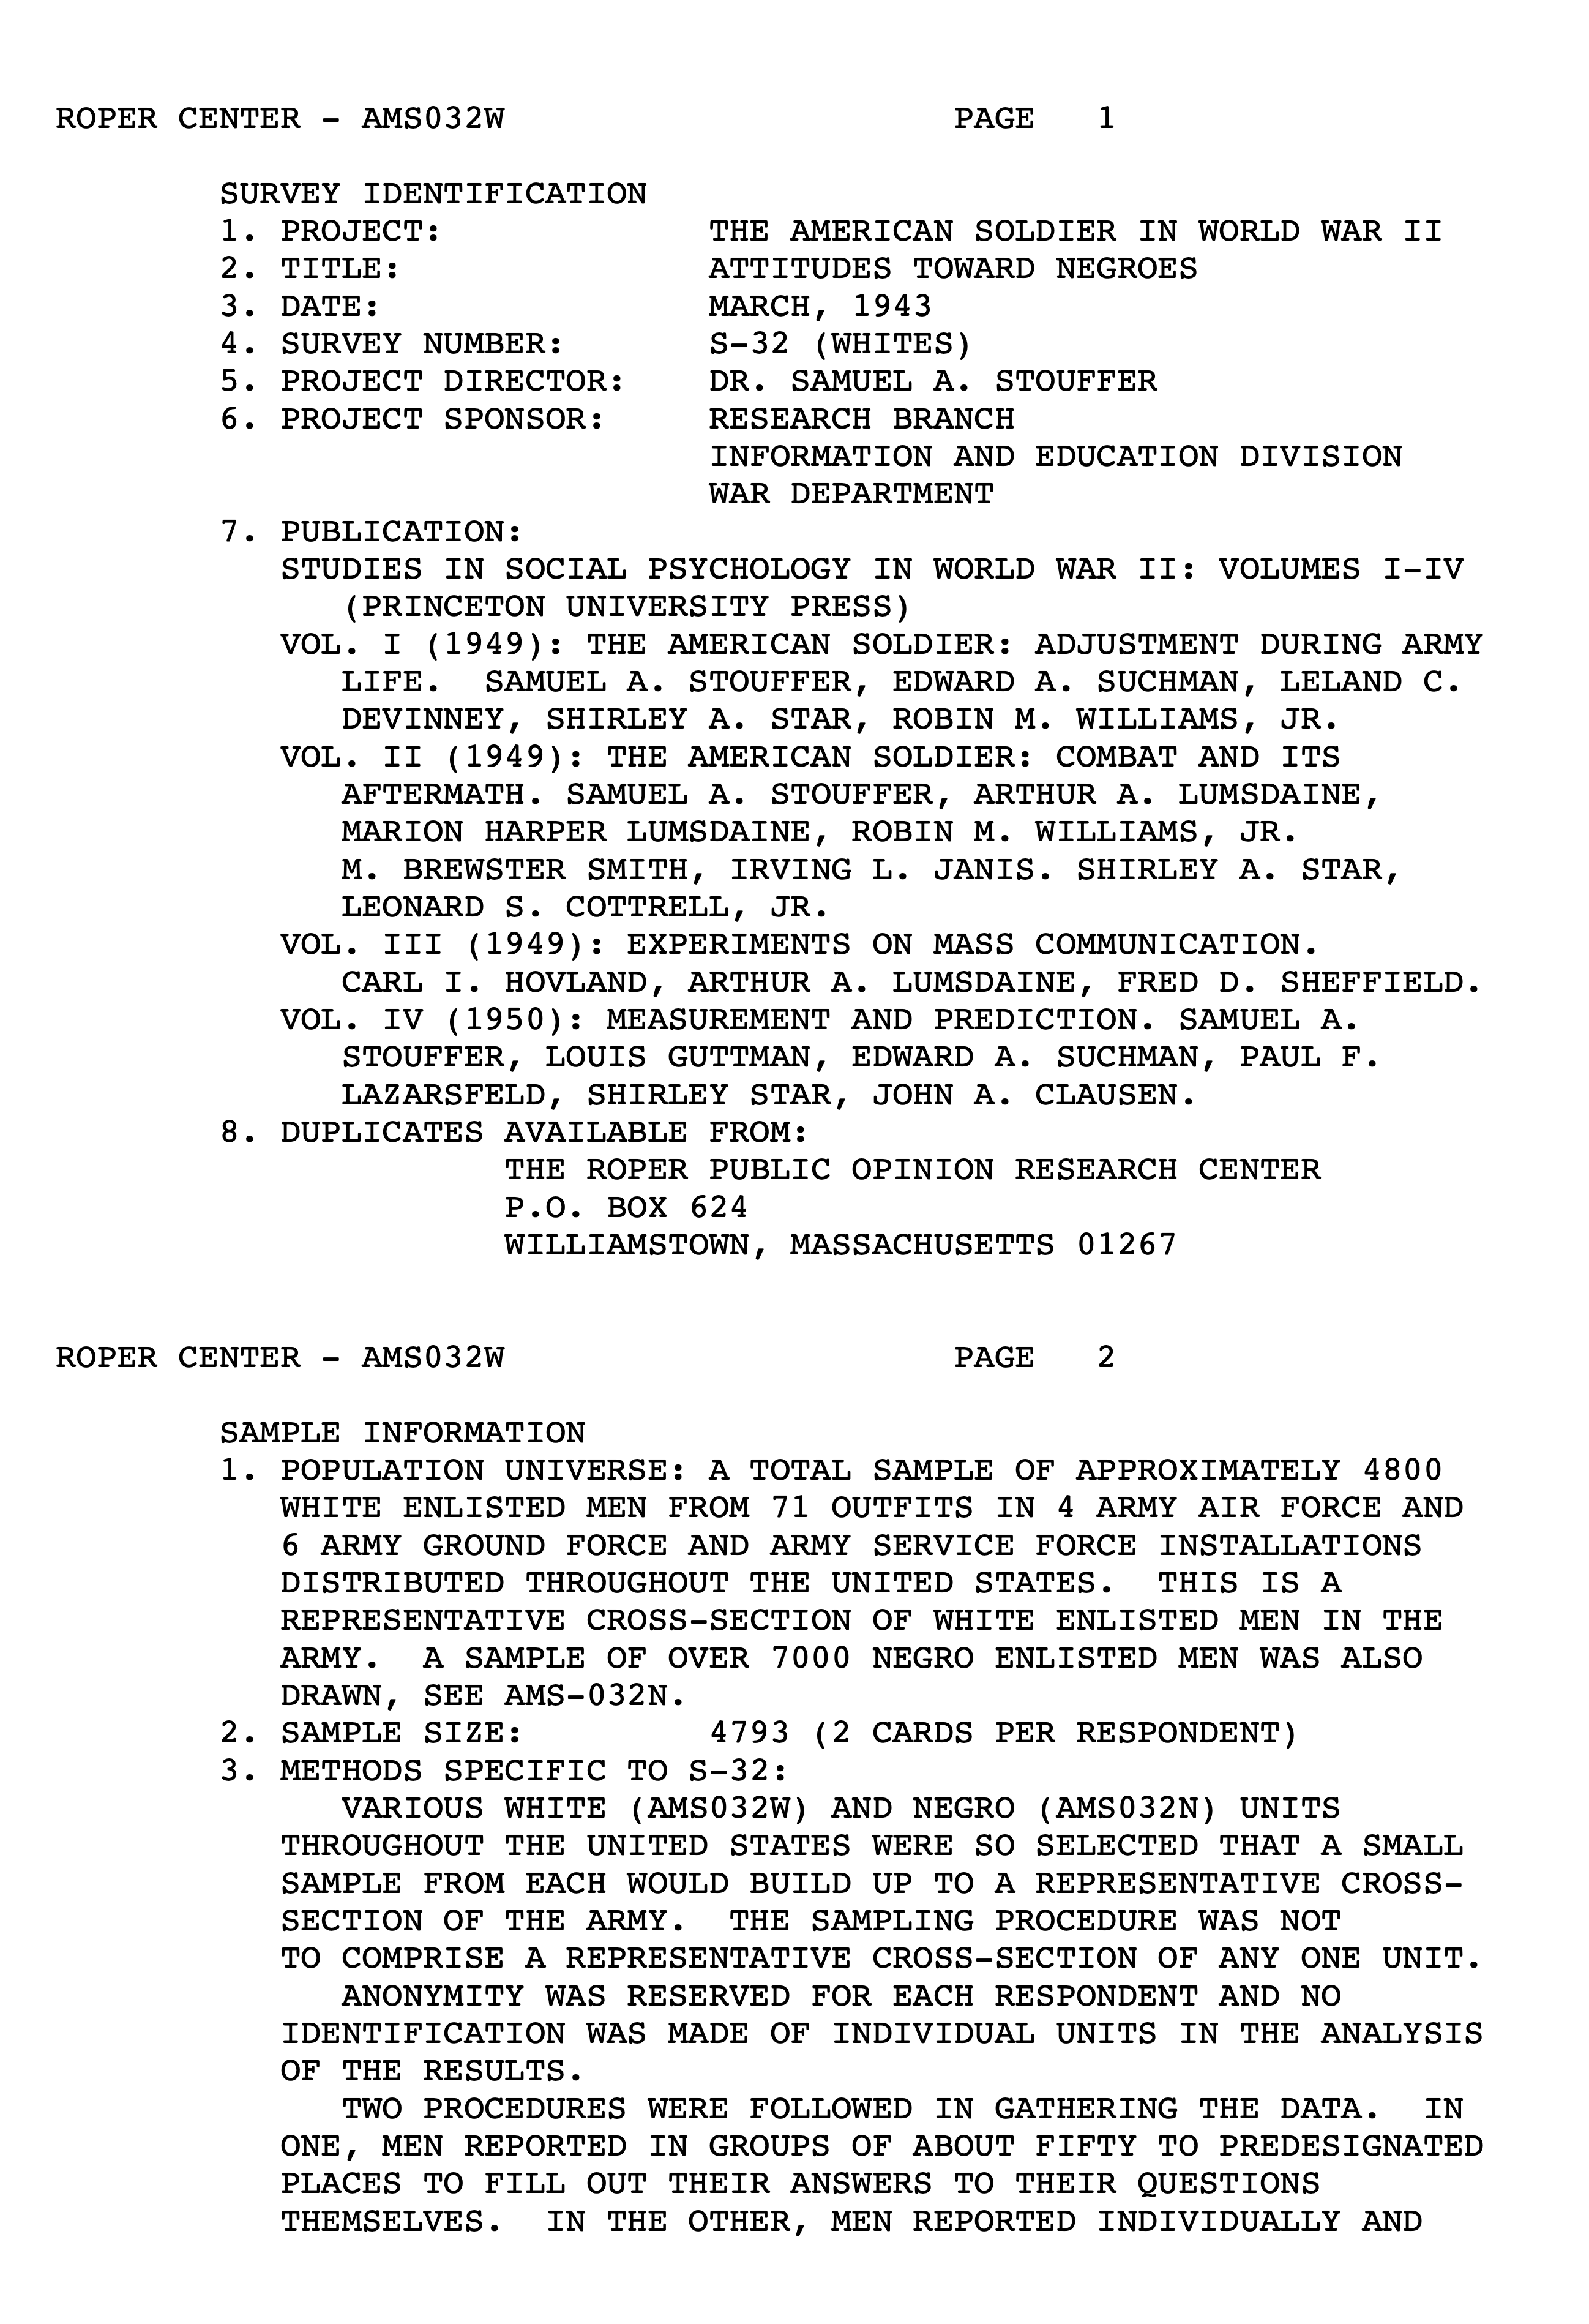
Sample Survey Overview for S-32W.
Each codebook opens with a summary of the survey, noting who was sampled—e.g., enlisted men, officers, or pilots—when and where data were collected, method of surveying, and sample size. A brief explanation of how the Research Branch typically collected the data follows this summary, along with any data collection methods that might be specific to that particular survey or questionnaire.
This explanatory information, in some cases, can be used to categorize respondents more accurately than might be possible if one relied solely on the data itself. Especially for multi-theater omnibus studies, Research Branch analysts designed different questionnaires for different subpopulations, such that a single study might have two and sometimes as many as seven separate forms.
Explanatory Codes
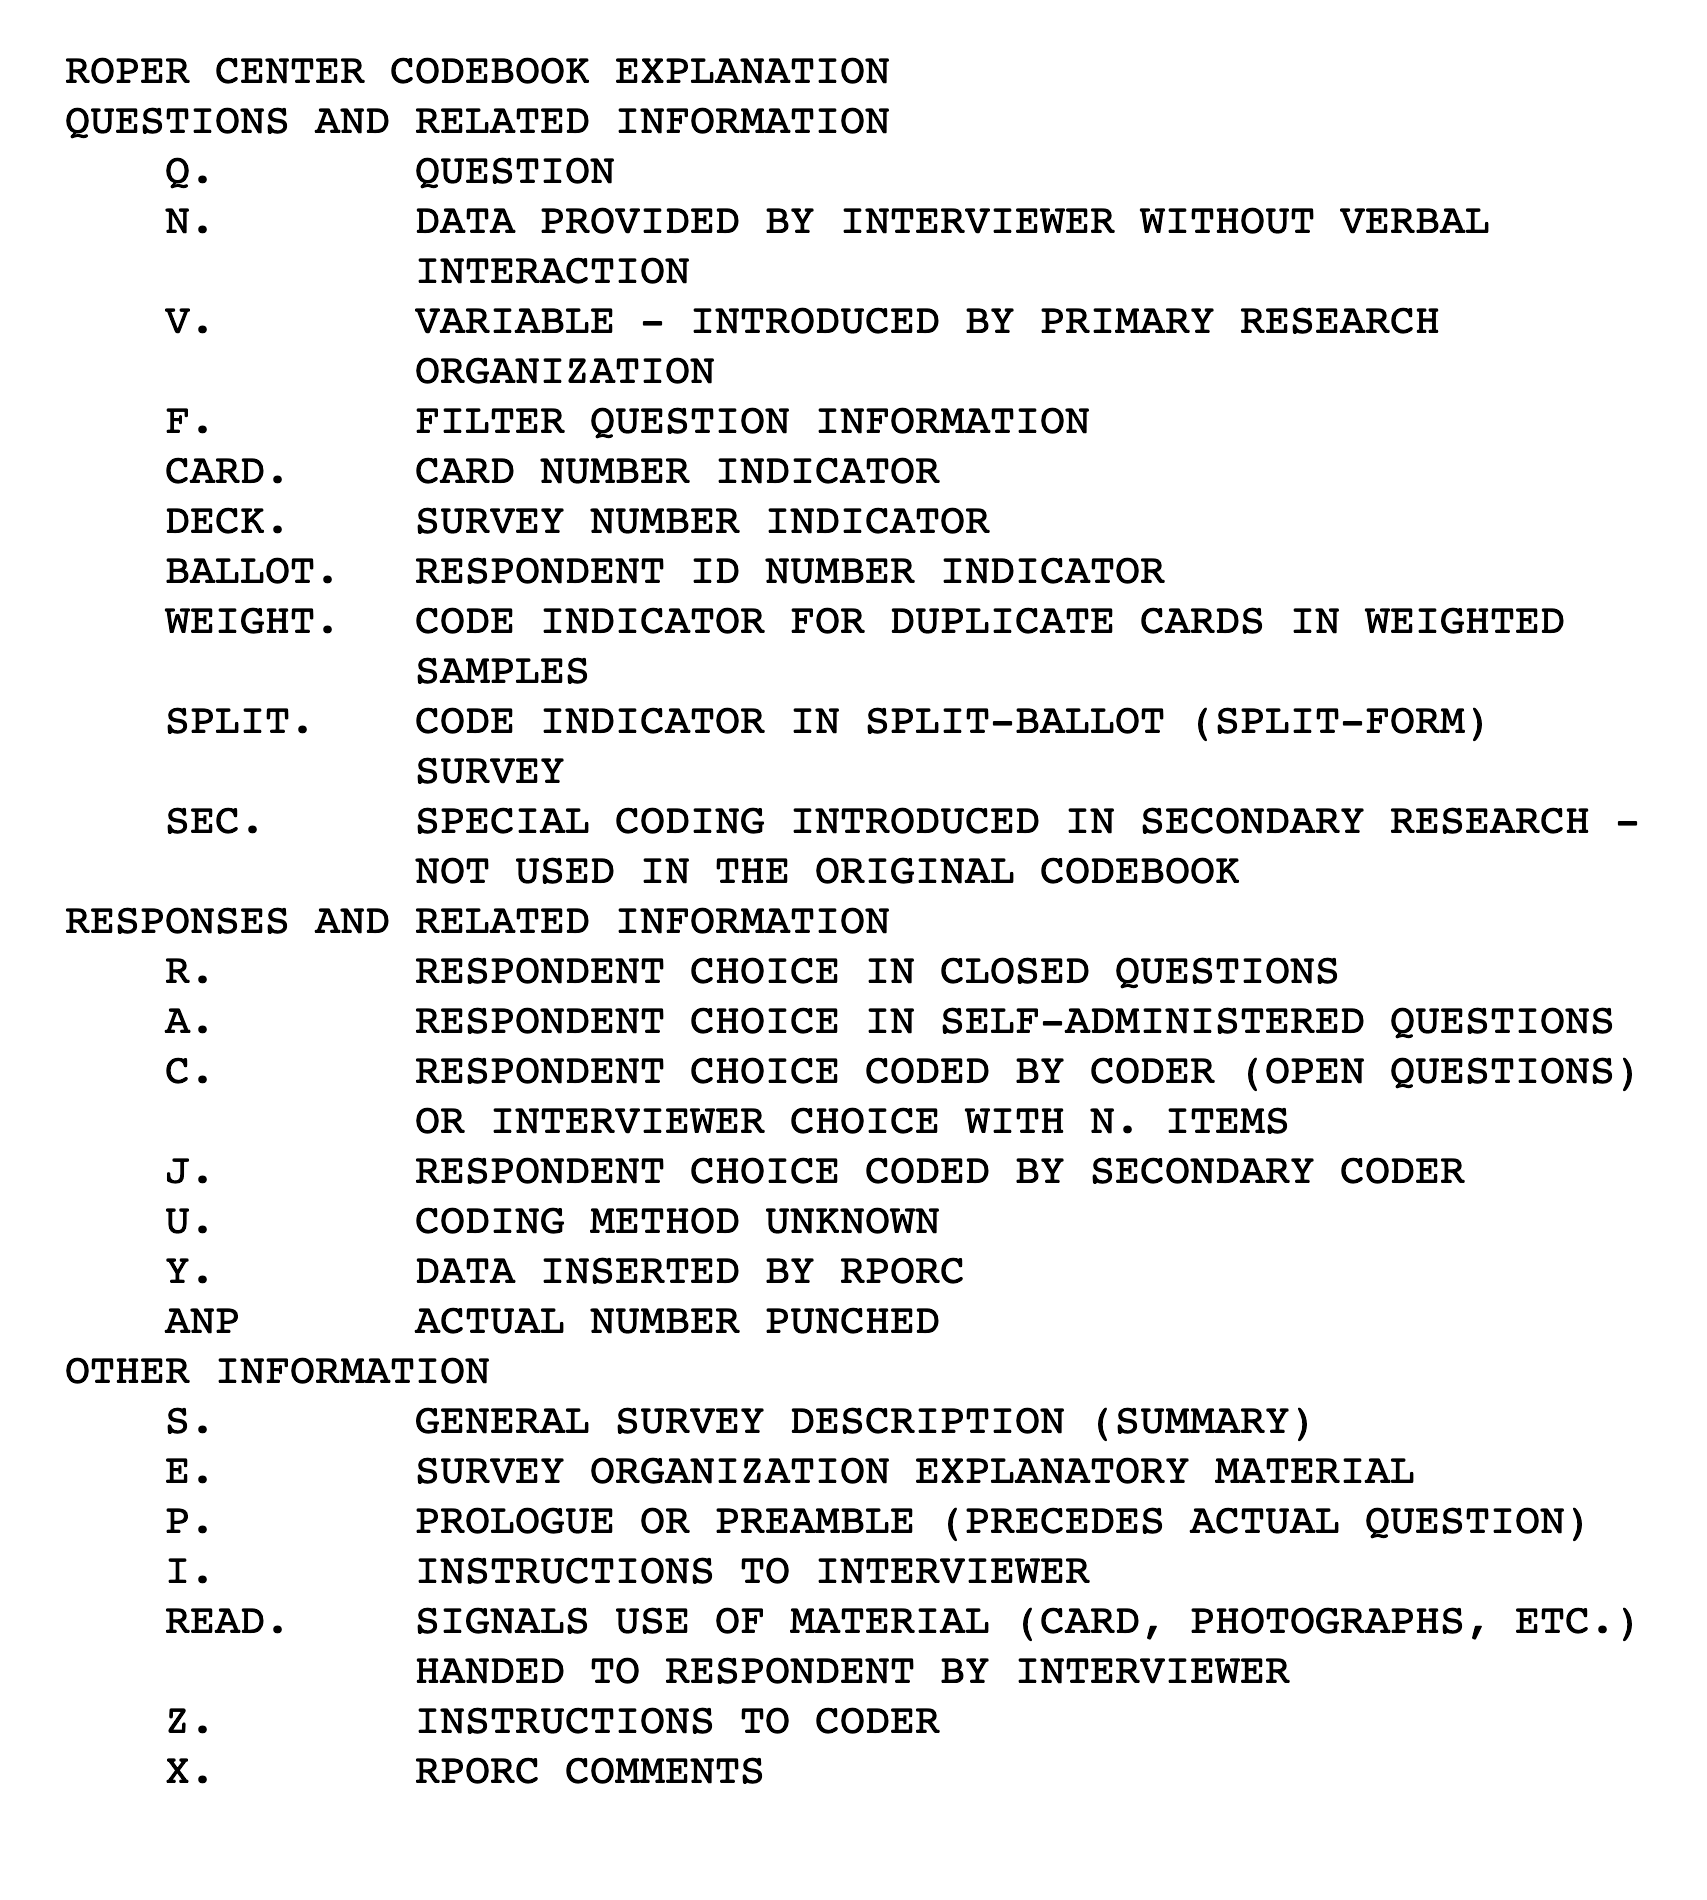
Sample codebook explanation of survey elements. Below are brief explanations of the most frequently occurring codes.
When the staff at the Roper Center created this machine-readable documentation, they added codes to explain the information in each line of the codebook. These allowed researchers using the data to understand the recoding of data in the transfer from cards to tape, to correlate data between the two media, and to relate both to the underlying questions and answers printed on original "schedules" or questionnaires.
The codes also allow researchers to know what data or explanatory information may have been added after the administration of a survey, and who added it, whether the Research Branch—referred to as Primary Research Organization, Survey Organization, and Coder/Secondary Coder—or Roper (RPORC).
Punch Cards and Card Columns
In the 1940s, the standard method for preparing quantitative data for tabulation and analysis was to transfer data from paper questionnaires to 80-column cards using a punch card machine. An 80-column punch card could contain 80 pieces of information. For each survey respondent, a single card was used if all the data fit on a single punch card; otherwise, multiple cards were required.
In the existing raw data, the data are arranged into card images, with each line of data containing 80 columns. If there was one card per respondent, then there is one line of data for each respondent, and if two cards per respondent, then two lines of data, so on and so forth. To maintain historical continuity, the codebook contains information on which card and in which column the response data for each question was punched.
Analysts who want to create their own data files from the original raw data may wish to use this information, but it is not relevant for typical users, who will most likely use statistical software to analyze the data. The SPSS files created for download were derived from the raw data and can be accessed using SPSS or some other software, such as SAS or Stata.
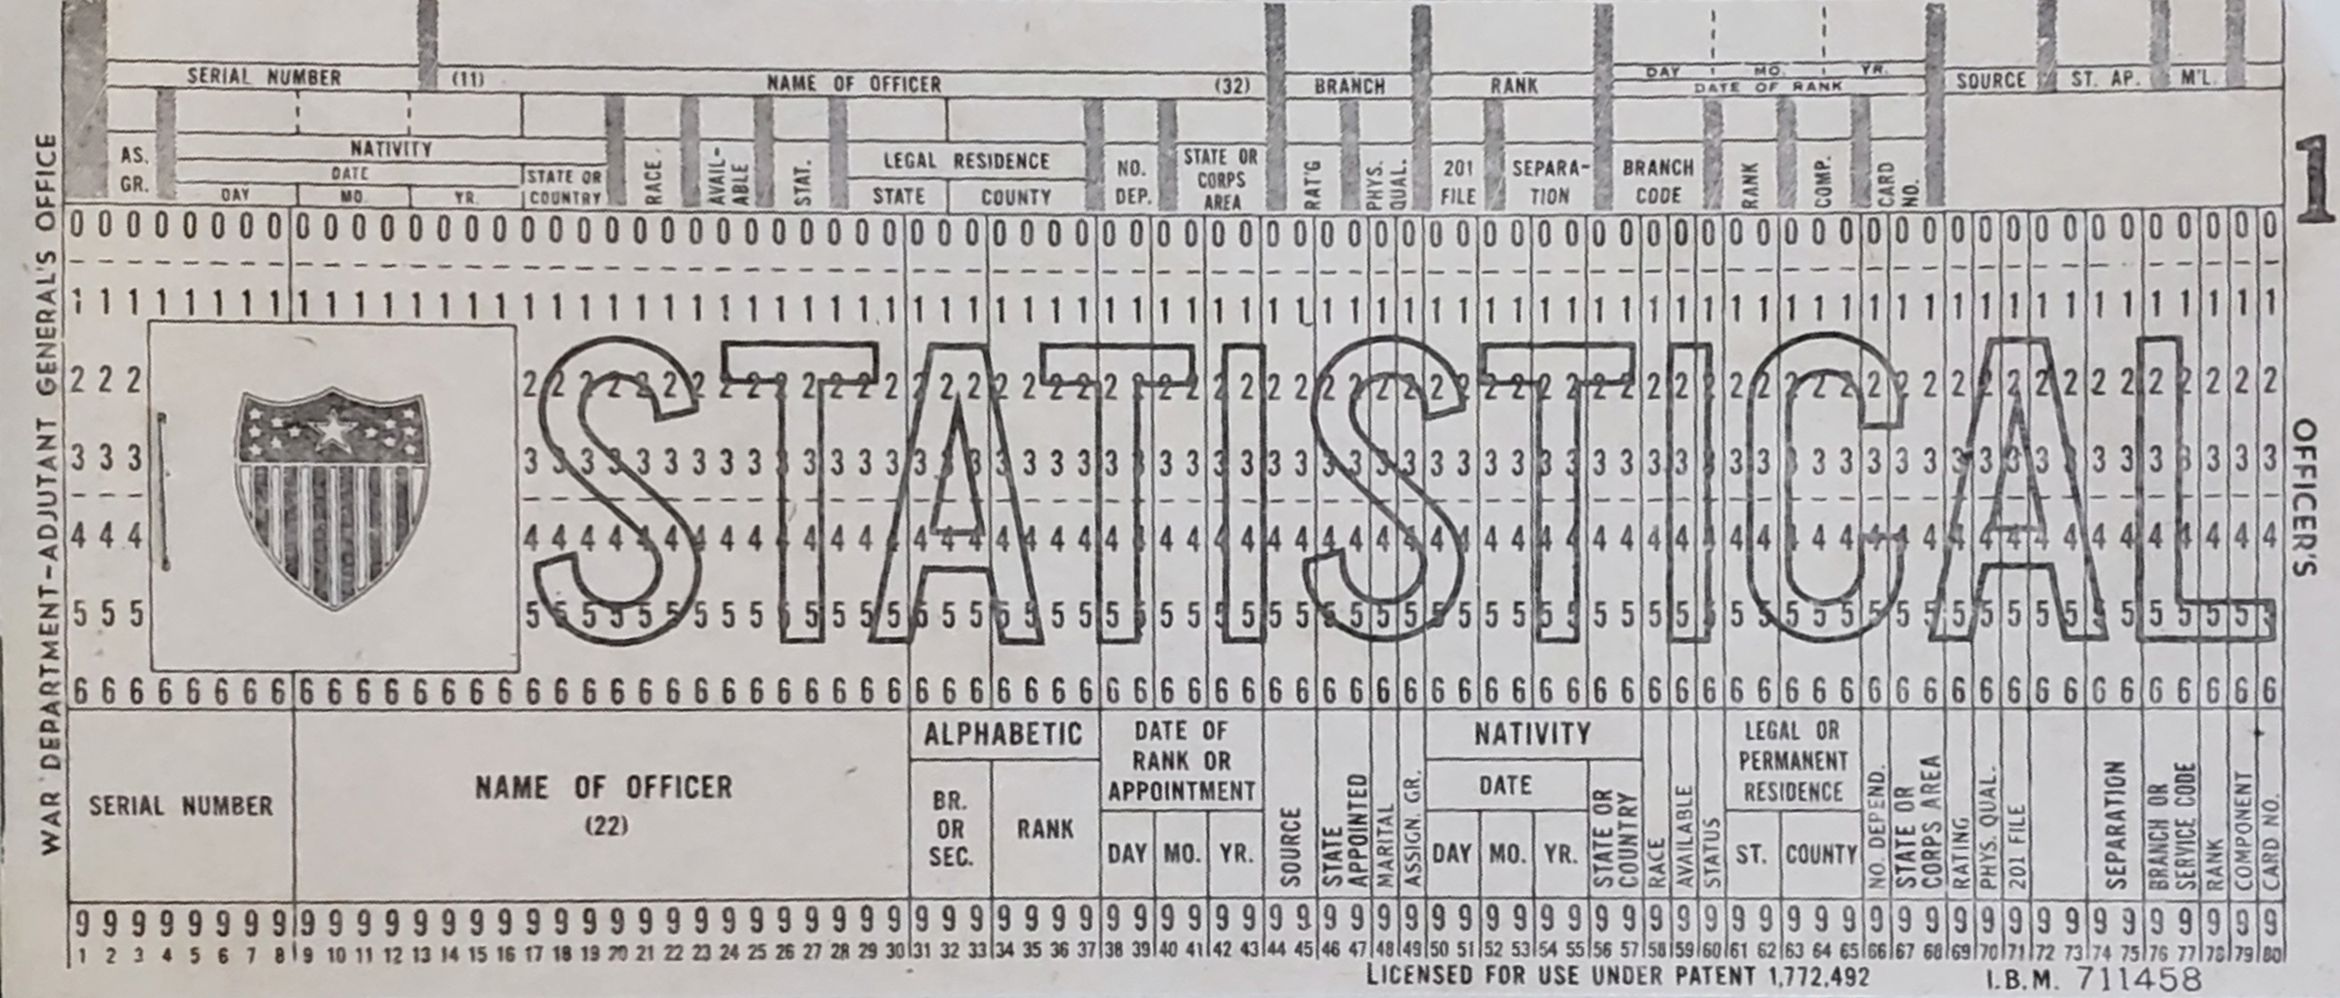
Typical IBM card used by the US Army during World War II.
Question Text, Response Options, Codes, and Frequencies
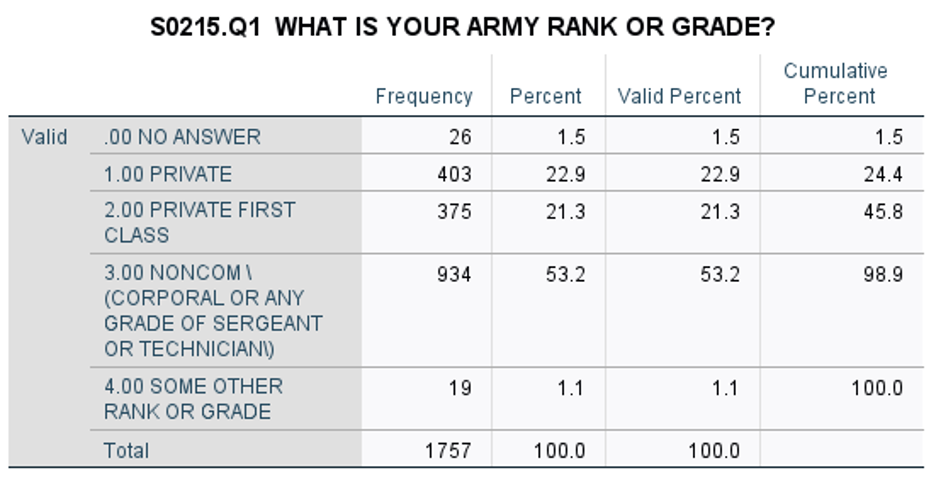
The majority of the question labels in the codebook, preceded by a Q, reflect the verbatim question that appeared on the paper schedule. Most of these questions are "closed," or multiple-choice, questions that provided the respondent a set of possible responses. For example, if a questionnaire for enlisted men included a question on rank, the codebook notes the question, the possible responses, the codes for each response, the numbers of soldiers who marked each response category, and the card column in which the coded response was punched.
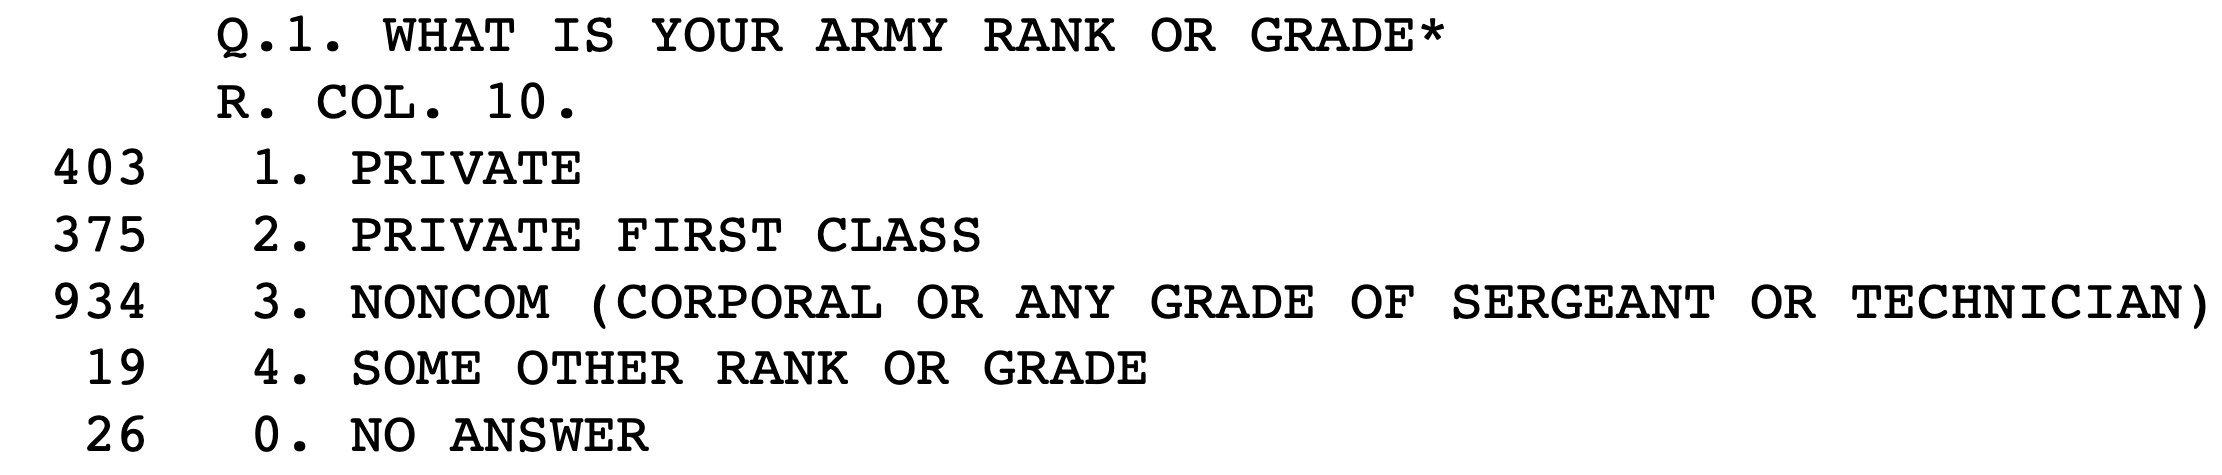
This example of S-215's first question shows that there were 403 survey respondents who indicated that their rank was “private,” and that the code for “private” was “1.” “Private first class” was marked by 375 respondents, coded “2,” so on and so forth. “R. COL. 10” shows that responses to the rank question were punched in column 10 of the original cards.
Survey analysts did not always use the same wordings for the same kinds of questions in different surveys. In some instances, analysts designed questions and possible responses to be appropriate for the particular groups of soldiers whom they surveyed, while in other cases they used different wordings to test the effectiveness of asking questions in different ways, or of presenting possible responses in varying orders. But sometimes, different analysts designed different questionnaires and worded things differently.
For instance, in S-32W, the rank question was asked this way: “What is your own rank or grade?” This is different from the example above, and if a study included officers, then officer-specific ranks were offered. An analyst may have wanted to capture finer gradations of rank and therefore used more rank categories as well. Instead of just using “sergeant” as a possible answer, for instance, they incorporated “master sergeant,” “staff sergeant,” so on and so forth.
Sample question, Q.1, from Planning Survey V, Form A showing finer gradations of rank and grade for enlistees and non-commissioned officers.
Questions and answers in the codebooks normally reflect what was on the paper questionnaire verbatim, but not always. For example, the original questionnaire might have had 16 possible categories for education, but either for ease of analysis and presentation or because there were too few cases in some categories for meaningful analysis, analysts recoded the responses into fewer categories. Exceptionally long questions or complicated sets of questions and/or possible responses were also rewritten, ostensibly to create codebooks with more consistent structure and formatting.
Issues arising from possible differences between the original questions and those in the codebooks can be addressed by accessing hardcopies of survey forms archived at the National Archives.
Constructed Variables
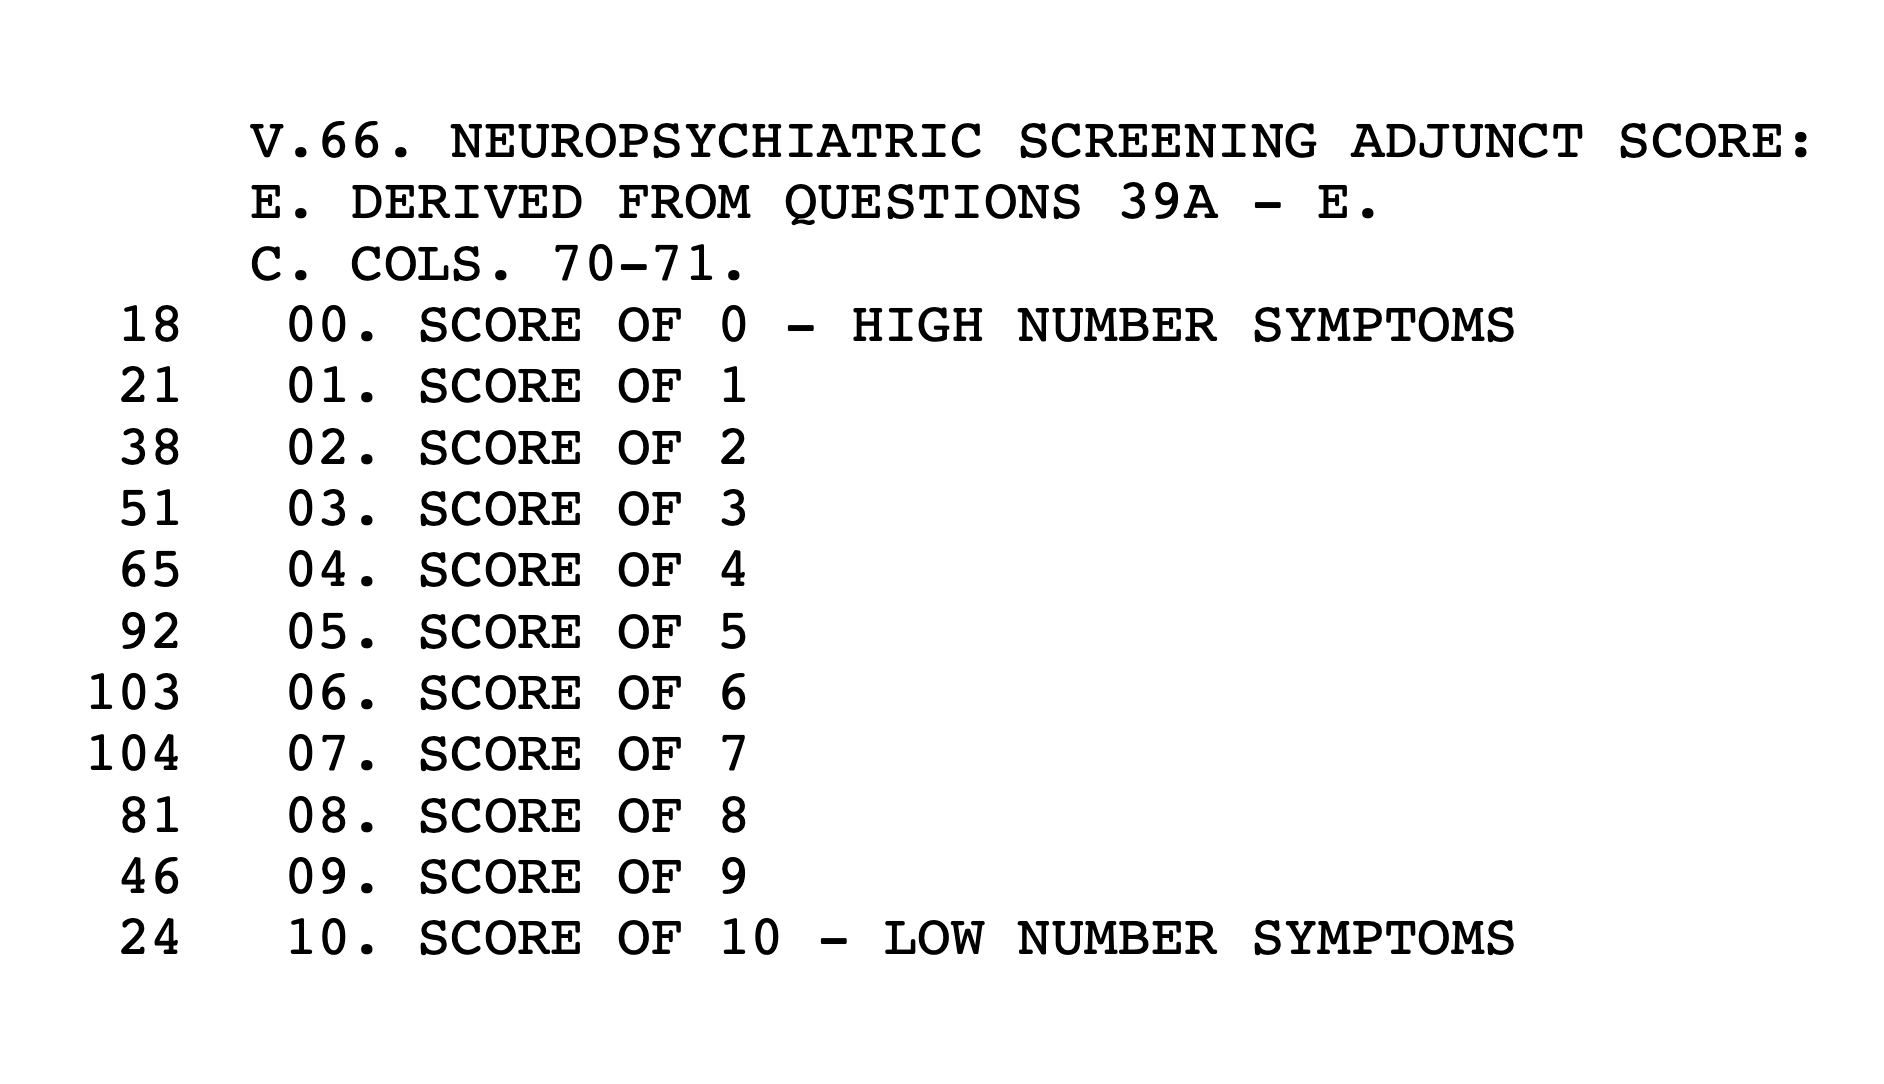
A Neuropsychiatric Screening Adjunct, or NSA, score for each S-100F respondent was calculated from answers provided in response to Qs 39A through E. In many but not all of the surveys with constructed variables, explanatory material from the survey organization (denoted by an "E") identifies the variables used to construct the new variable.
Roper used a V instead of a Q to indicate that a variable was not on the original paper schedule but had been constructed by the army's research staff and added to the data.
Usually army analysts created these constructed variables by combining responses to several questions into a single variable. For example, S-100F has five questions designed to measure neuropsychiatric symptoms. After the data were collected, analysts combined responses from five questions to create a single composite "score" for the respondent.
Questions with Lists of Possible Responses
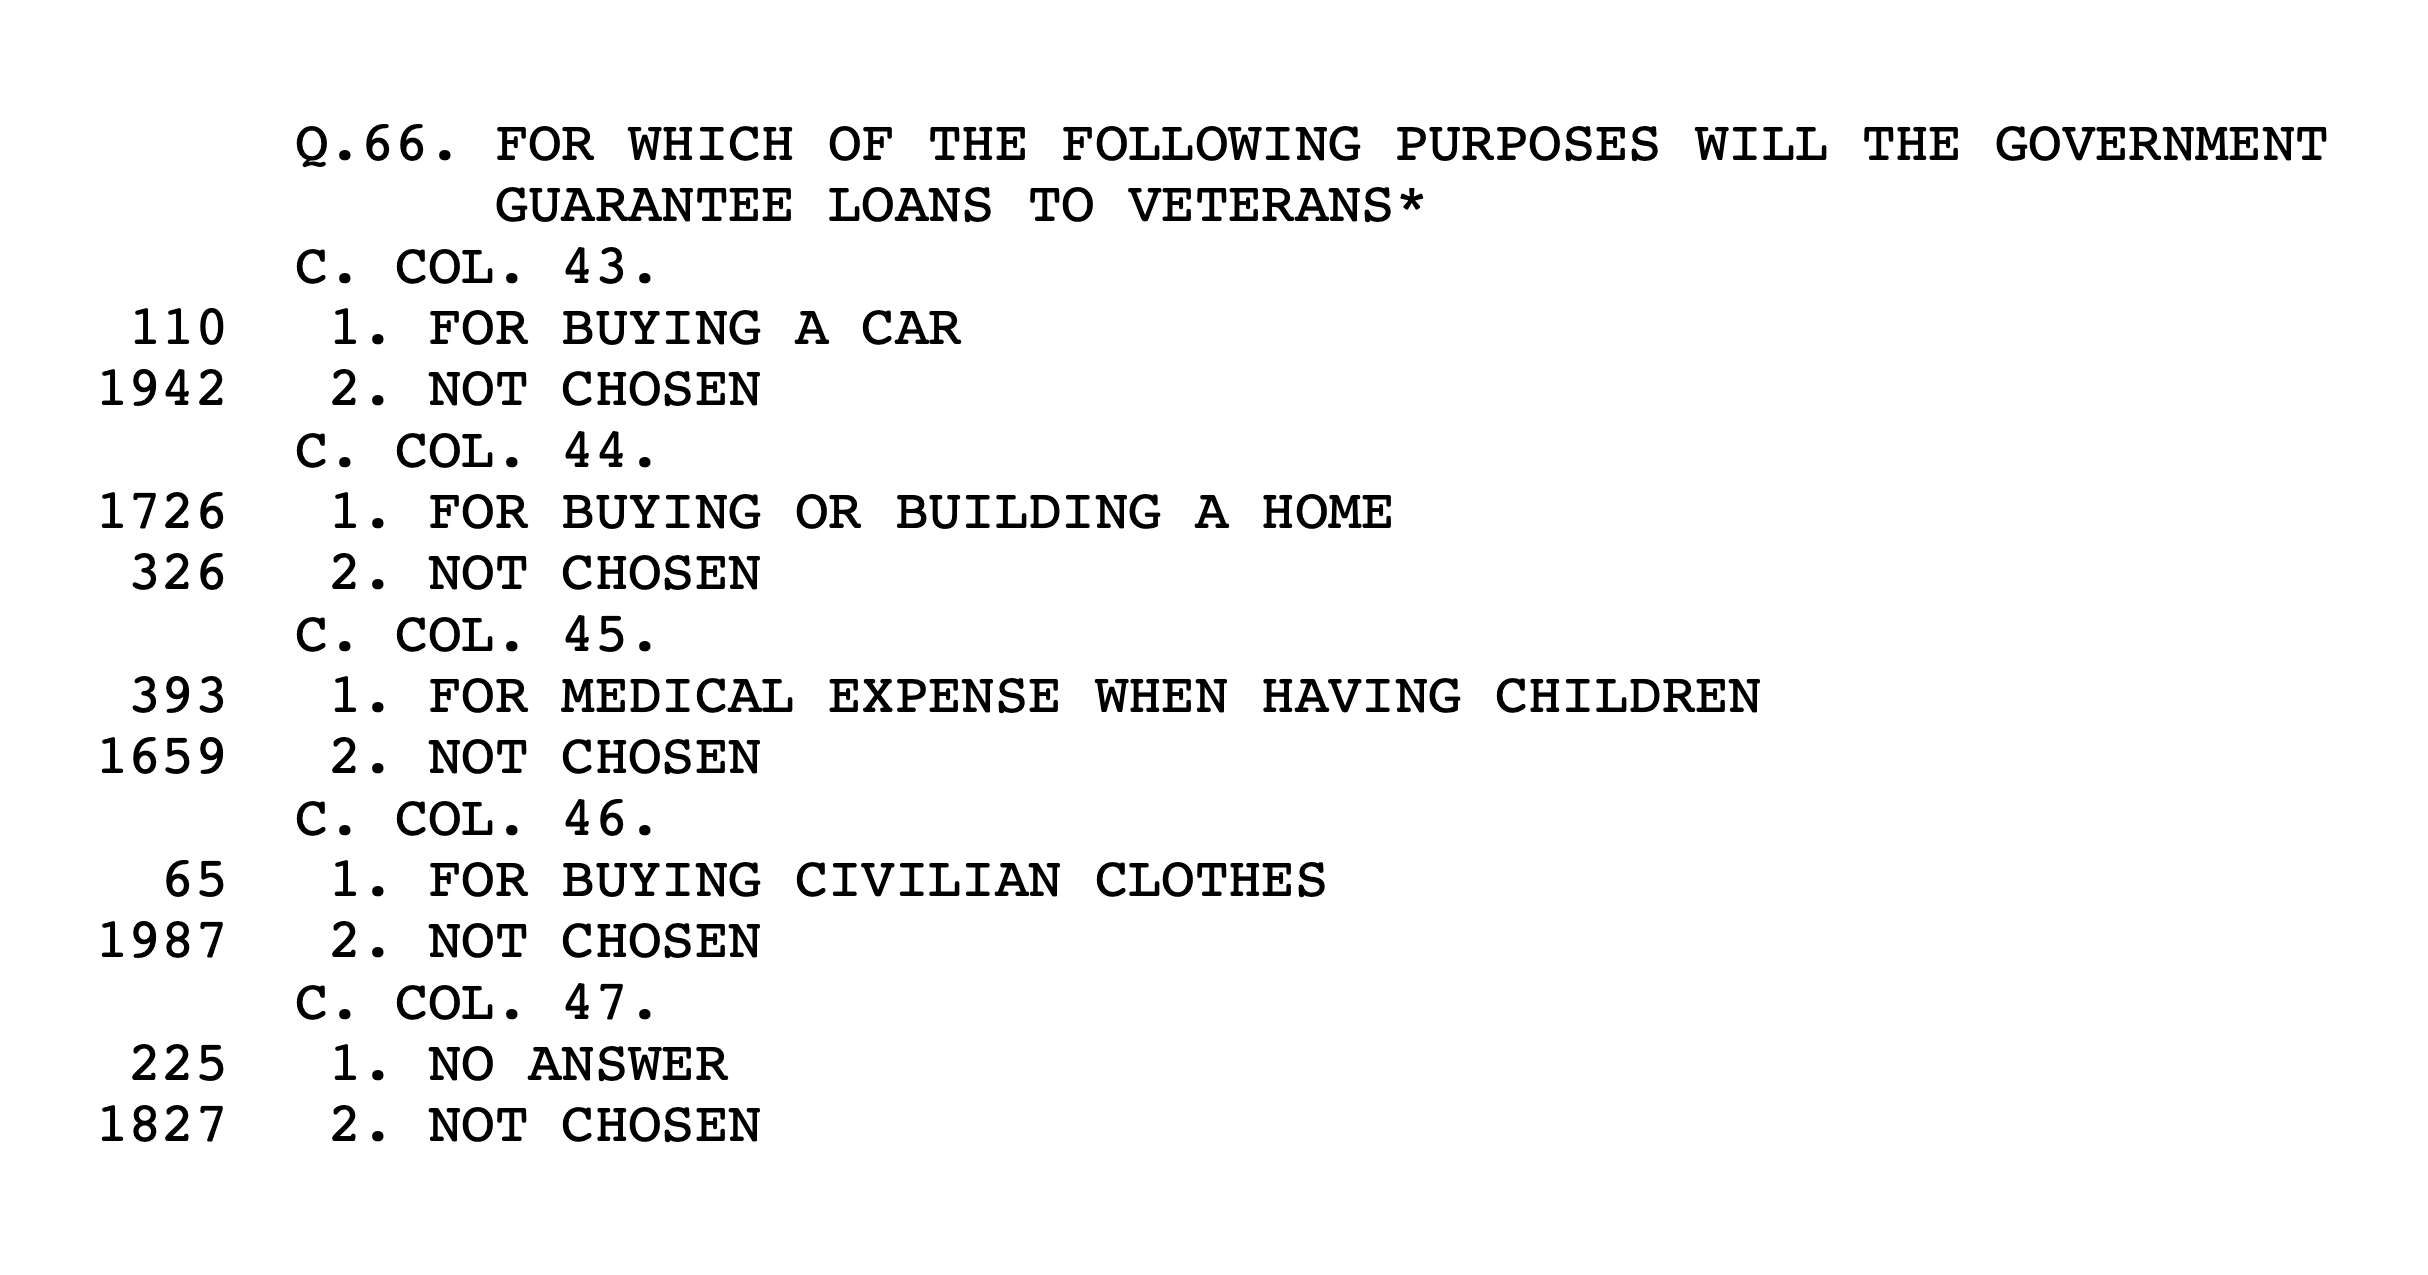
Some forms have questions with response alternatives that were not mutually exclusive. That is, soldiers were given the option of choosing more than one response to a question. In the following example from S-211A, soldiers were asked a question to elicit their knowledge of the GI Bill. The items in the list of possible responses appearing on the paper questionnaire were assigned a separate punch card column and are displayed in the codebook as the first option. If the respondent selected an item in the list, their response was coded "1," and "2. Not chosen" if they didn't.
Free Responses
Questionnaires typically ended with a question that asked respondents to write out a free response. In most surveys, the prompt was entirely open-ended, as in Planning Survey I, Q.118: "If you have any remarks to add to this survey, please write them here just as fully as you like."
In the 1940s, these broad open-ended responses, as well as any other short handwritten response, had to be turned into an integer if they were to be transferred efficiently onto punch cards.
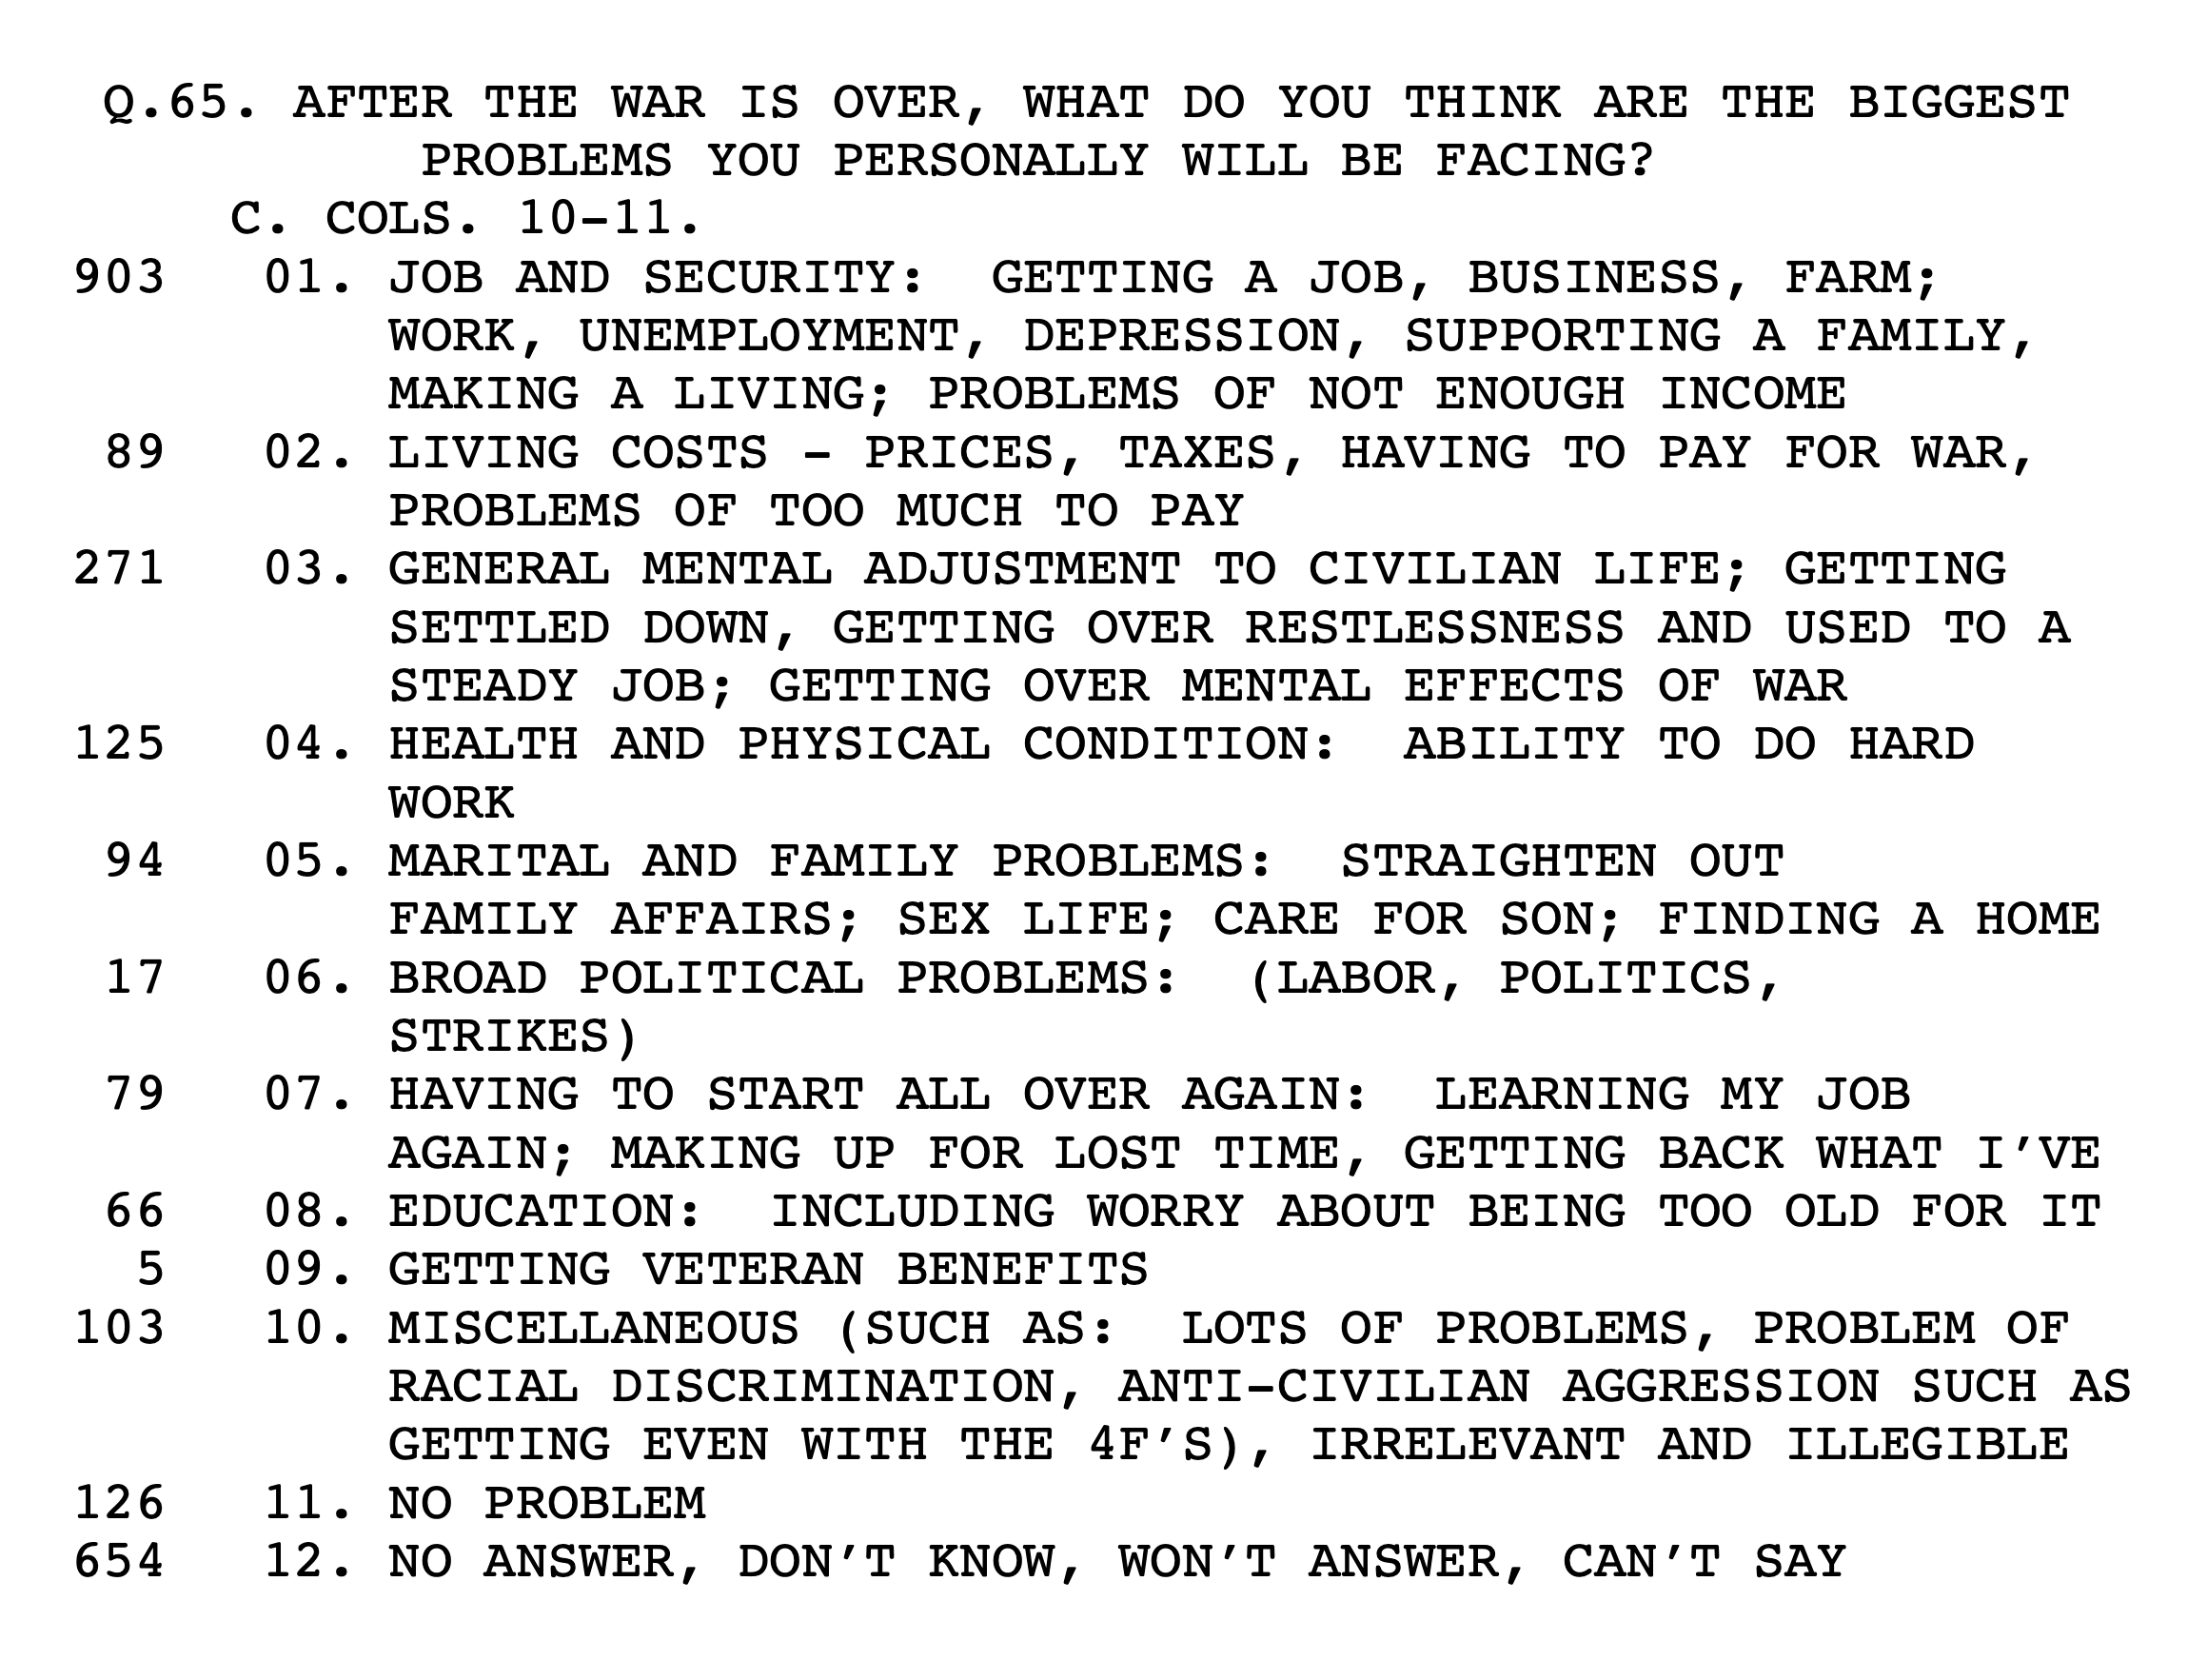
Here is an example from Survey 177, Q.65 of how open-ended responses were summarized by analysts and coded. The frequencies to the left of the categorized and coded responses show the number of survey respondents who expressed the same or similar sentiments. Codes were punched in columns 10 and 11 of the computer card.
In some instances, analysts used a code simply to note that a respondent had written something on the questionnaire, while in other instances no codes appear at all in the data. In the latter case, Roper added a simple comment preceded by an X to note this absence.
Still, in many cases, an analyst read and interpreted the responses, classified responses with others sharing a similar opinion or attitude, then assigned codes for each category. These codes appear with short classification summaries in the codebook, preceded by a C, for "Respondent choice coded by coder (open questions)."
While transcribing the free responses, the Zooniverse community transcribed the handwritten text on scanned survey pages as well as any coding added by the Research Branch during its processing and analyzing of data. Explanatory information about the classification of responses, derived from archived Research Branch records, appear both on the site and in the downloadable datasets as metadata. For the following example, volunteers transcribed both the written response and "5081," corresponding to the respondent's unit and the serial number on the questionnaire, as explained below.
Free Response Answer 24-1484
Handwritten verbatims were themselves lost when paper questionnaires were discarded, although some responses were transcribed by Research Branch staff. But of the original documents, only those pages microfilmed in 1947 and digitized in 2017 are known to still exist.
When NARA digitized this collection, file names were created for each page that reflect the number of the originating microfilm reel in the collection and the page's location on the reel. We have maintained this schema, as it allows anyone to connect scans available on this site to the 44-reel collection accessioned by NARA. In this example from S-141 for free response 24-1484, the first two digits, 24, refer to reel 24, and 1484 to image number 1484.
Metatags
Zooniverse citizen-archivists who transcribed free responses were asked to render the scanned pages as faithfully as possible and with minimal editorial intervention. Any changes a respondent may have made to the question or answer text for standard attitude items (multiple-choice questions and answers) were categorized as "marginalia."
To capture visual attributes of handwritten text, transcribers could add metatags, which are rendered as formatted text on this website. Several of these metatags required manual entry, and while efforts were made to correct those that were inconsistently structured during transcription, inevitably some will appear on this site not as formatted but as plain text. For a description of how metatags were used during transcription, see the project's Zooniverse Field Guide.
Variables with Minimal or No Explanation
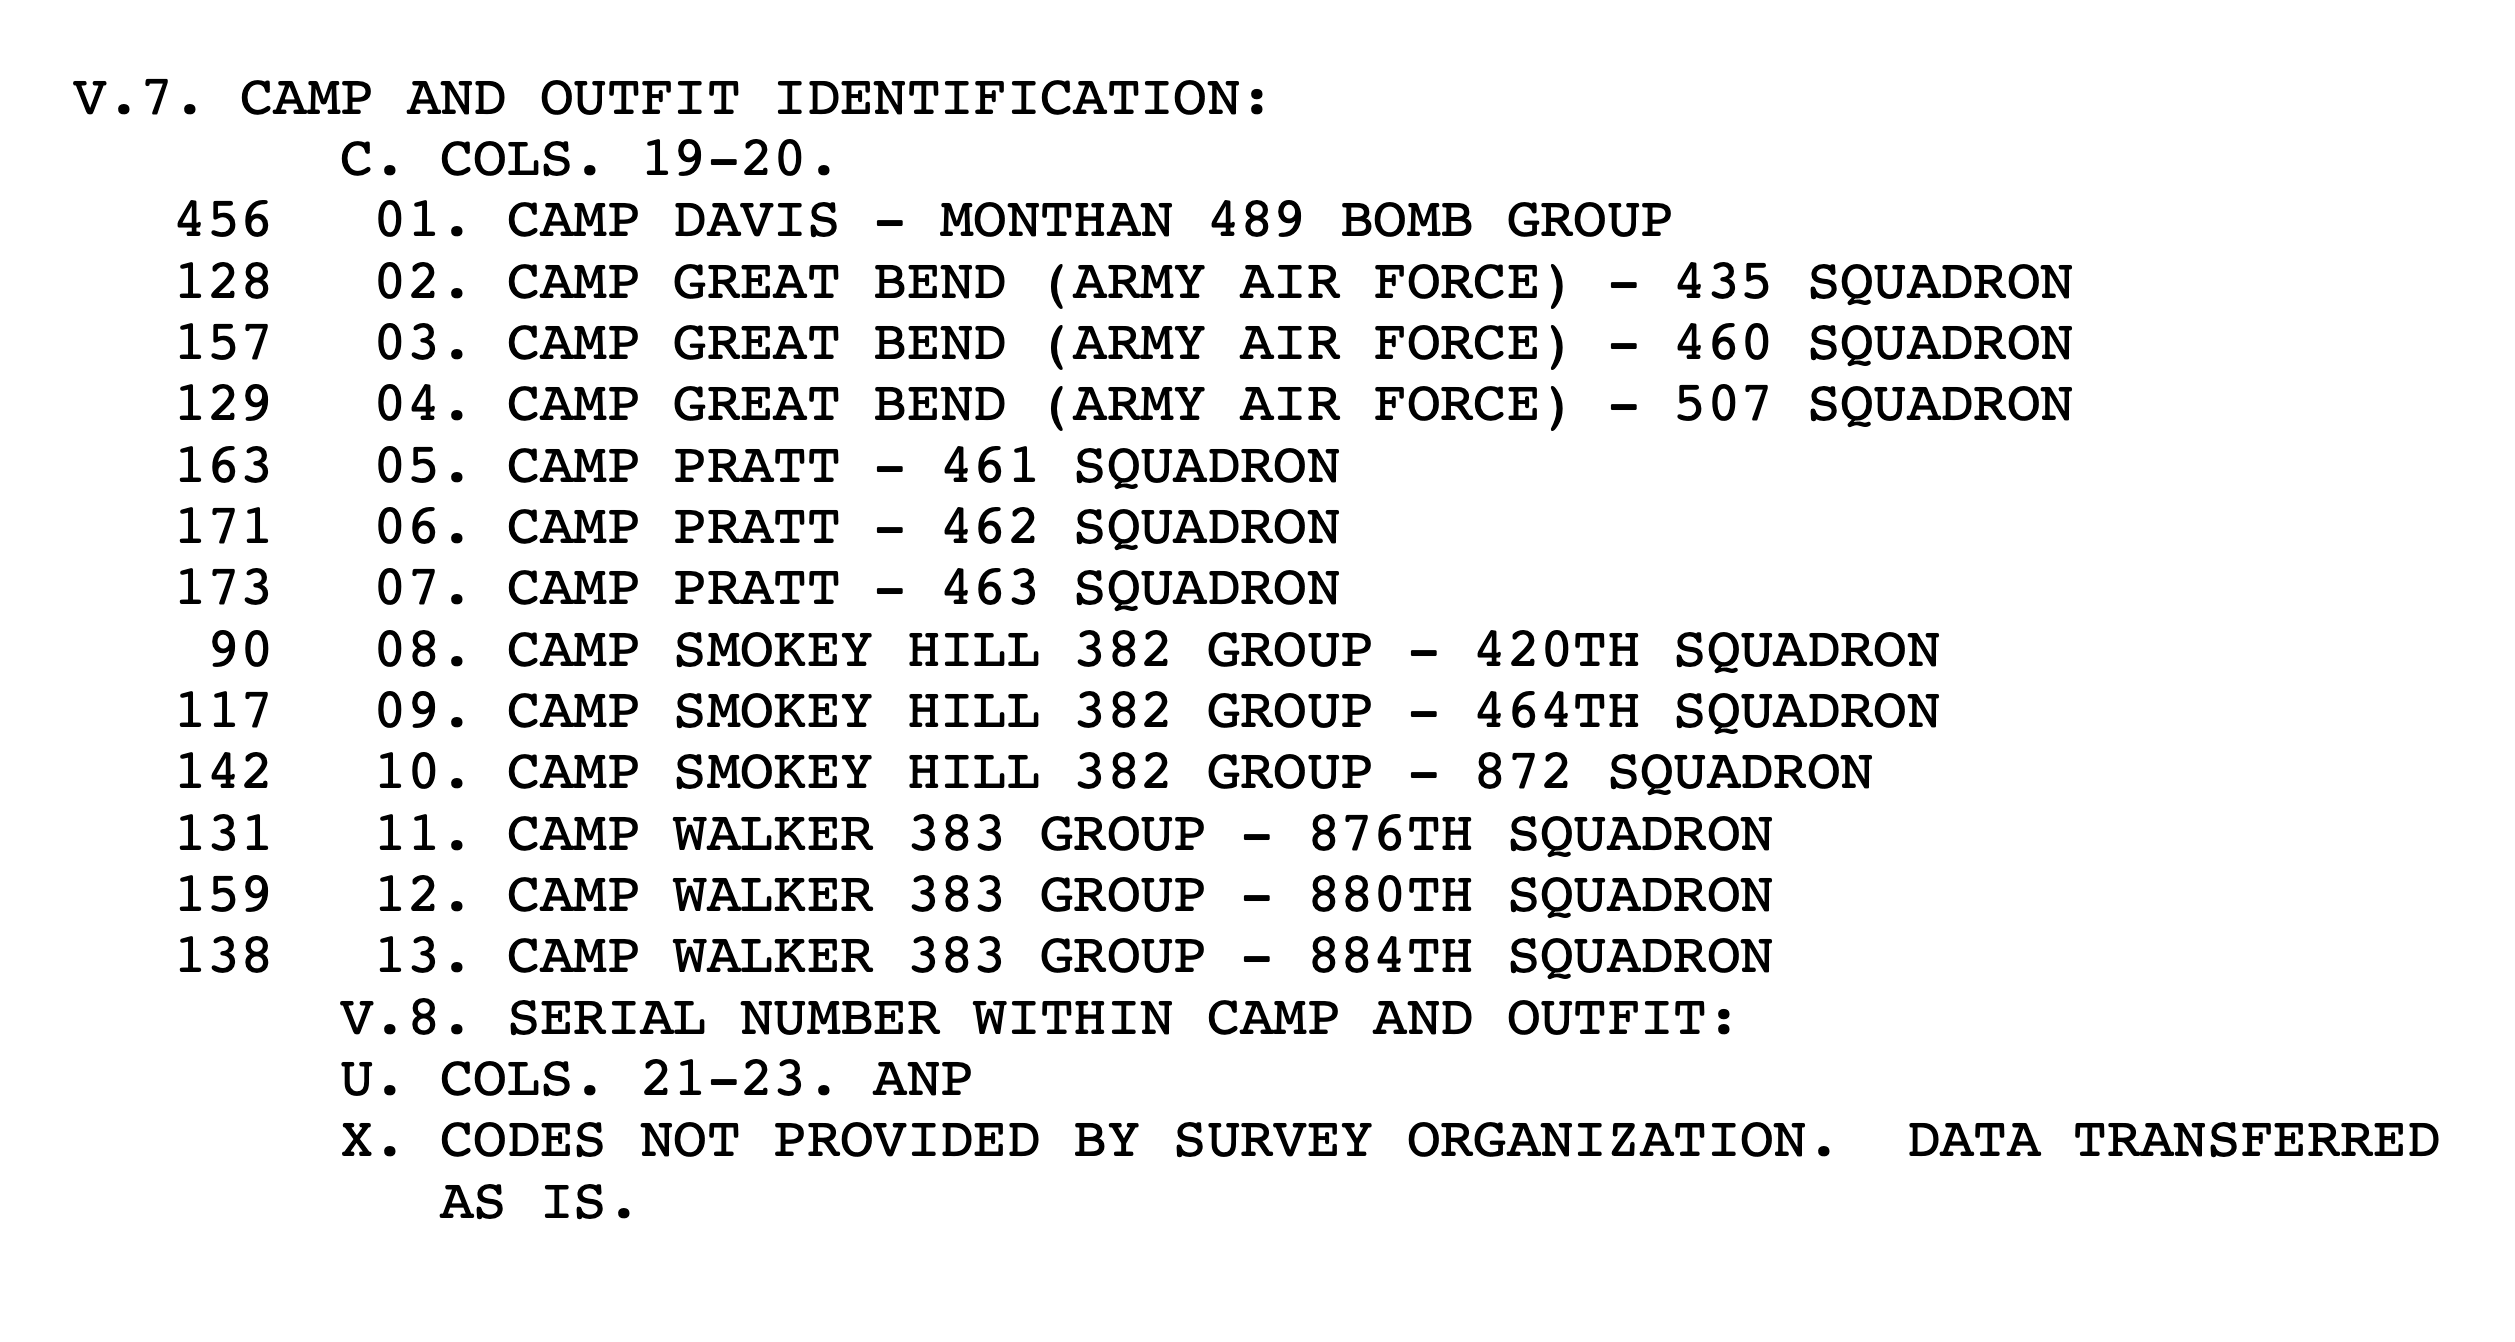
An example of a serial number transferred "as is," or ANP, from S-207F. The variable preceding V.8 contains the camp and outfit identification for each respondent.
On some surveys, this serial number was written on the last page that had the soldier's free response, and if such a number was written on the schedule, it, too, has been transcribed. These handwritten serial numbers typically capture both the camp and outfit identification (V.7, in this example) and the respondent identifier (V.8)—always in that order. Free response 24-1484, with the number 5081 written at the bottom, is an example of this.
The staff at Roper provided a code of ANP, meaning “Actual Number Punched,” for variables for which the original response was expressed as a number and could be transferred "as is" without translation, or when they found in the data cases where no explanation for the recorded values was available in the study documentation. Often these are for unit and/or camp designations, or for survey respondent serial numbers. Researchers might be able to figure out what ANP data mean by reading information at the beginning of the codebooks, by tracing patterns in how similar data (say, for regions) were coded in other surveys, or by consulting archived survey documentation at NARA.
Free comments and survey responses have been reconnected for a number of S-141 respondents using data forensics. This may be possible for other surveys but would require consulting archived study documentation. For some surveys, the camp and outfit identification were transferred ANP, because the identification was unknown. Also, Roper did not always use the same codes when transferring punch card data to tape, further complicating the reunion of qualitative and qualitative data.
Survey Parts
Most of the survey questionnaires were single forms, with the questions numbered sequentially on the schedule. The first question was Q.1, and the last corresponded to the total number of questions (e.g., with 50 questions, the last question would be Q.50). These questions could contain one or more secondary questions.
Survey designers might also break up a single questionnaire into parts. In the codebook, these breaks appear with the code PART in the middle of the page, with asterisks on either side. PART would occur at the beginning of the second part, then be repeated with any subsequent parts.
Some questionnaires have as many as five parts. In studies such as these, the question numbering might restart with Q.1 at the outset of each part, but in other instances question numbering may not restart at all. Question IDs for surveys with parts of this sort will contain a Roman numeral to identify a new part if the numbering was restarted (e.g., S207F.Qii1B refers to Survey 207, Form F, Part 2, Question 1B).
Questionnaire Forms
More common than parts are different questionnaire forms, like the several used for Survey 207. Forms were devised when analysts wished to elicit the same or similar information from soldiers of different rank (e.g., officers and enlisted men), in different theaters (e.g., the Pacific Theater, the Mediterranean Theater, etc.), or from different military organizations within theaters (e.g., the 25th Infantry Division, the 5307th Provisional Regiment, etc.).
For most studies that employ different forms, Roper created datasets for each as though each were a distinct survey. For example, studies S-207F and S-207G have separate survey data files, one for Form F and the other Form G. The codebook will include the code “FORM” at the beginning of each separate card to indicate which form is used. The questions asked in two forms are often different. There may be many differences, or the differences may be subtle, with some questions asked with slightly altered wording.
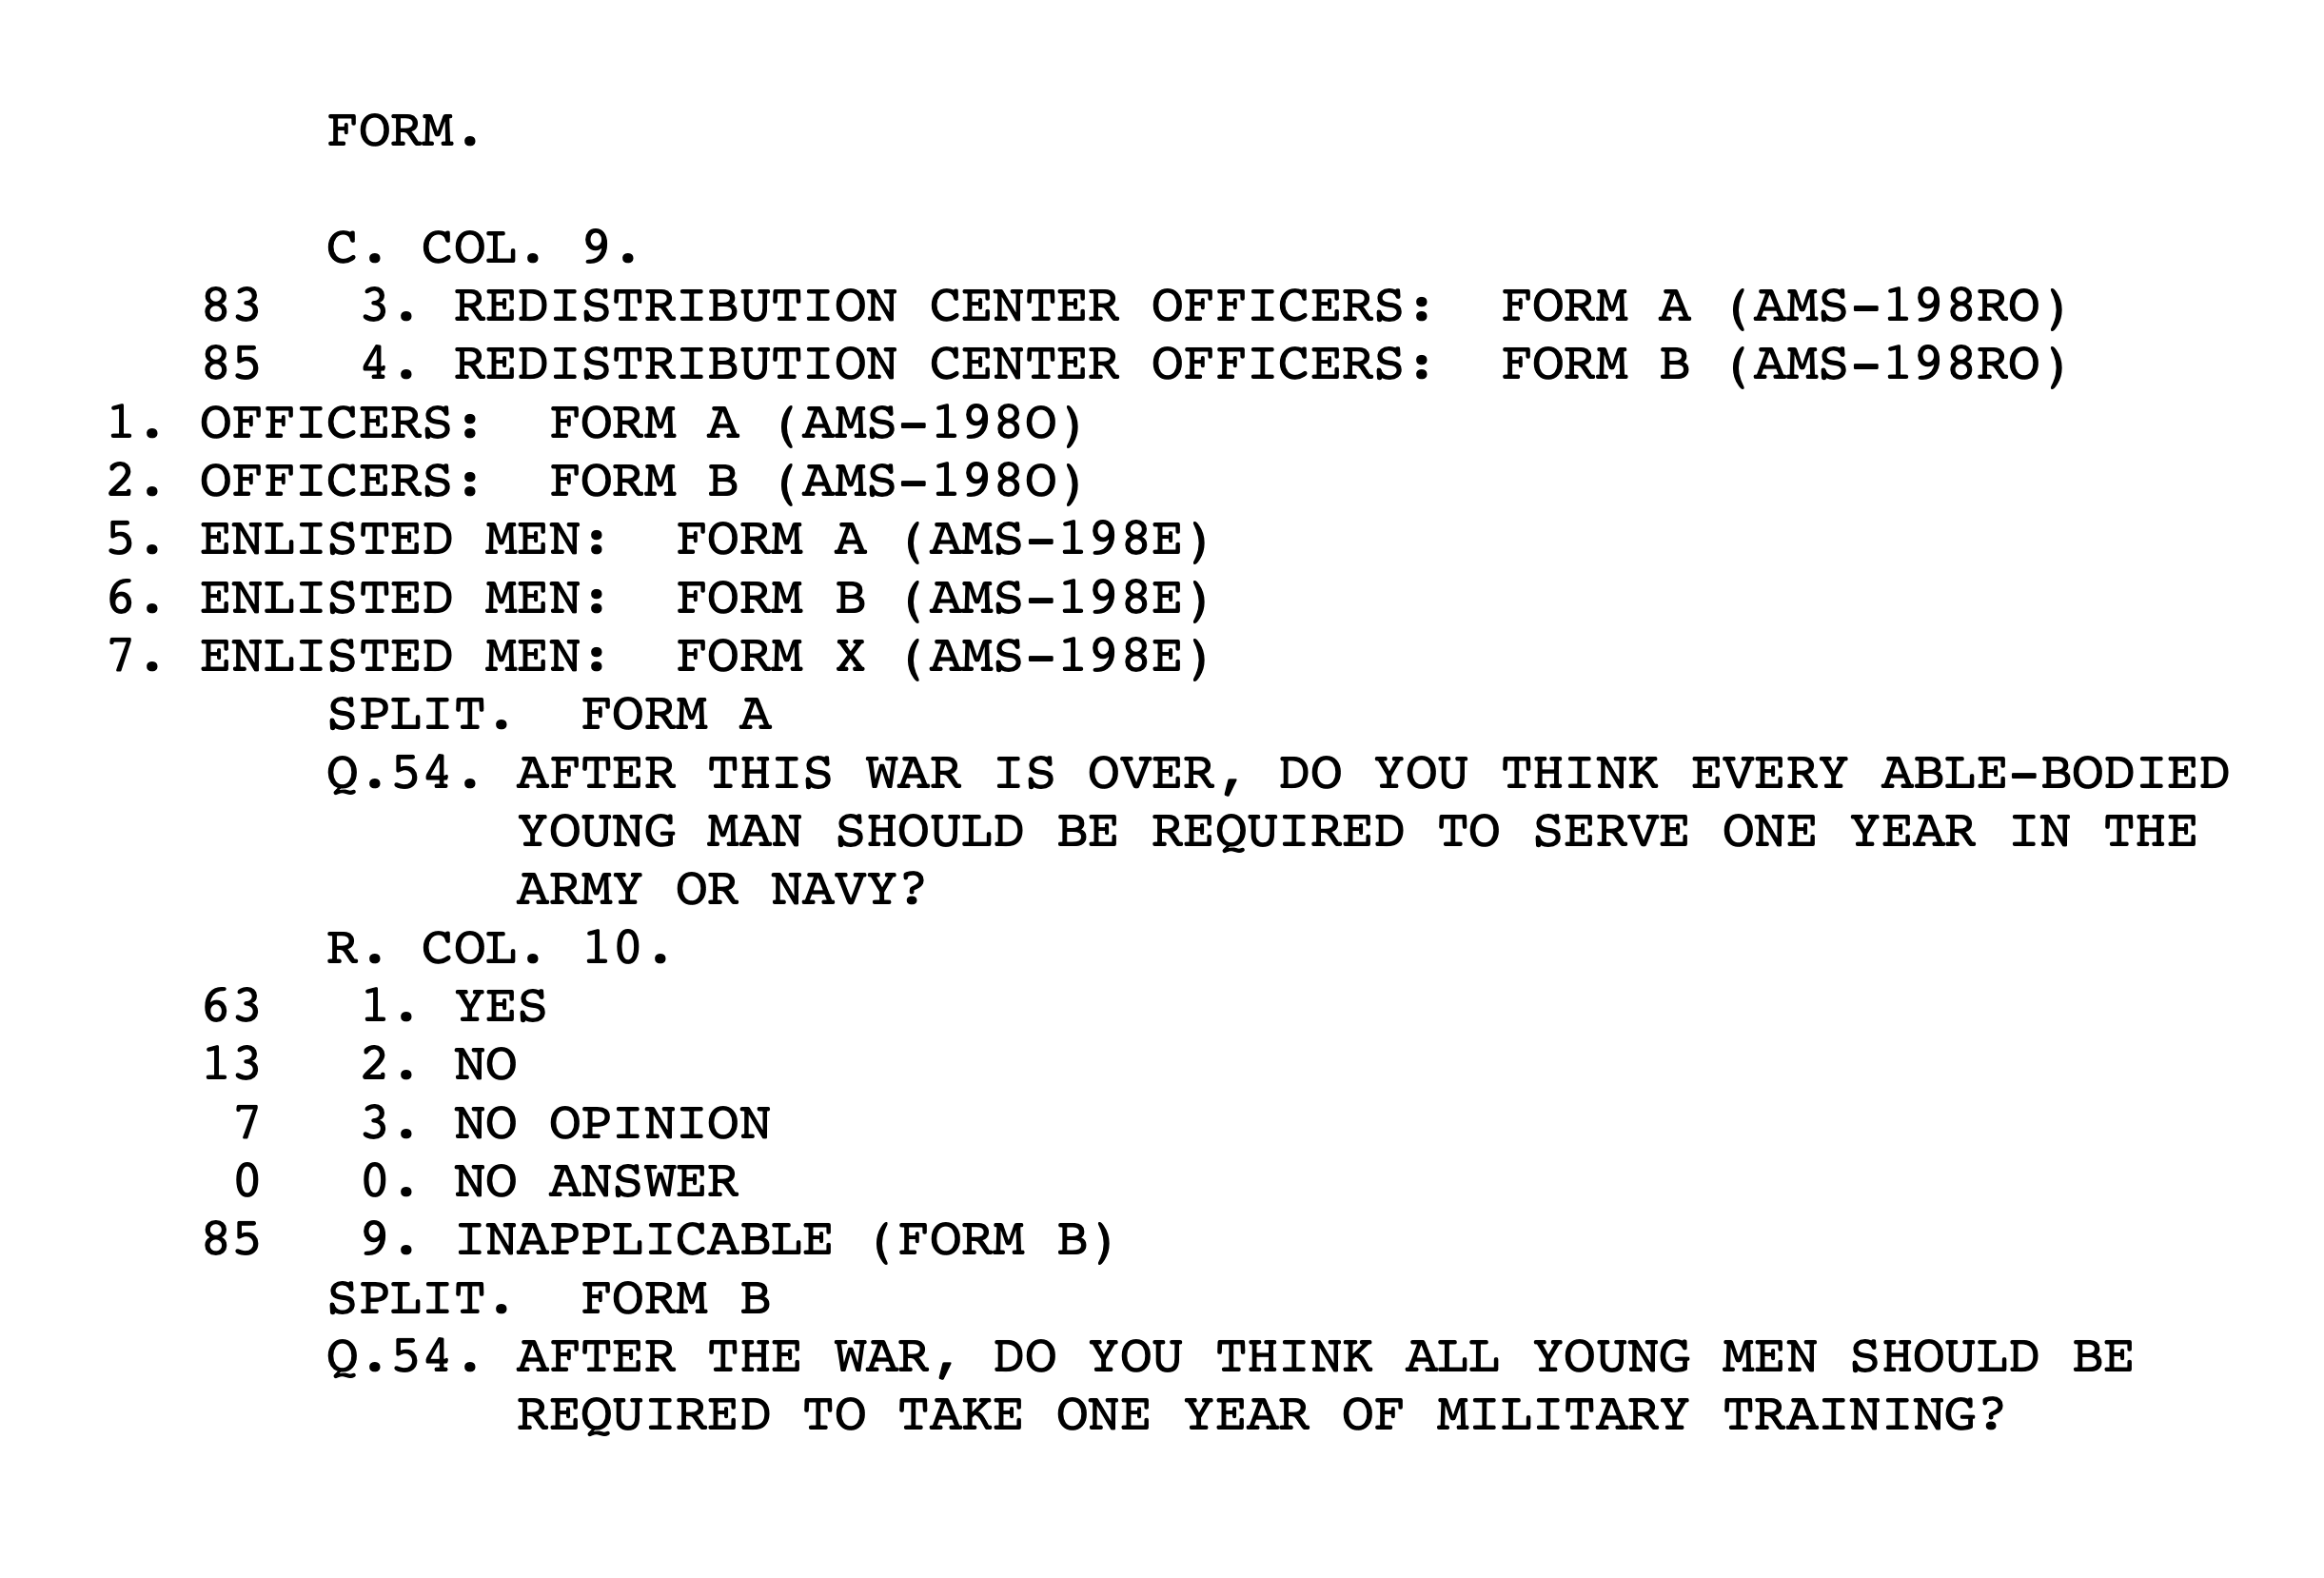
This is an example of a questionnaire from S-198 containing multiple questionnaires, two officers (S-198RO and S-198O) and one for enlisted personnel (S-198). Each of these contains two or, in the case of S-198E, three forms. The codebook uses both SPLIT (defined below) and FORM to note the branching of questions on the questionnaire.
Occasionally, however, multiple forms have been consolidated into a single questionnaire. As a result of consolidation, only one data file and one codebook are available. The word FORM written in the codebook, along with a brief explanation, marks the beginning of a form on the questionnaire. These studies typically open with a set of common questions asked of all soldiers, followed by questions specific to a particular subsample, or group of soldiers.
Regardless of which type of form was created and administered, the datasets available for download match the NARA and Roper electronic file collections. On the website, though, the forms having their own dataset will all appear as questionnaires under the primary study (in the example above, S-207).
Sample Splits
Some studies have multiple parts of a different sort, called a SPLIT, which denotes a single sample that has been split, with some respondents being asked one question or set of questions, and others within the sample a different question or questions.
Ballot Variable
Every survey respondent was assigned a respondent identifier during initial data encoding. This variable is called a BALLOT. These numbers are sequential, with 1 being the first respondent and the highest number being the total number of respondents.
Note that the term BALLOT is used in some research programs (e.g., the General Social Survey) to indicate what was described above as a SPLIT. That is not the case in Research Branch surveys, for which a ballot is only a respondent identifier.
Consult survey codebooks not only to understand the particular use of ballots by the Research Branch, but also other issues that might arise while interpreting the data, whether the labeling and coding of variables and responses, the ordering and numbering of questions, or the use of parts, forms, and splits. These are the most reliable guides.
SPSS Files
SPSS Variable Names and Variable Labels
The raw data, along with the card and column information in the original codebooks, have been used to create SPSS system files that are available for download. SPSS is the Statistical Package for the Social Sciences, a data management and statistical analysis system.
SPSS system files include all the original data for each survey organized as a set of variables. The survey questions appear as variables. Each variable has a variable name, a variable label, and, for response categories, a value label. SPSS allows users to transform variables or combine them into new variables. Analysts can also use SPSS to output data into other file formats, such as Excel, csv, STata, or SAS.
An example of an SPSS printout from Survey 215, which includes the variable name, variable label, and value labels.
“S0215.Q1” is the variable name, derived from survey ID and question number. The variable label is “What is your Army rank or grade?” And the value label contains the response alternatives "Private,” “Private First Class," etc., and their response codes.
Be aware that the SPSS files are a work in progress. Refining and clarifying some of the labels, especially longer or more-complex labels, in the SPSS files is an ongoing process. Because of this, the current versions of the SPSS system files should be considered beta versions.
While lengths of variable labels are not constrained in plaintext codebooks, they are in SPSS, at 256 characters, resulting in truncation. Researchers should consult the original codebooks to get the full question for these variables. In a very few cases, questions were also truncated in the process of creating the original codebooks, and in these instances, researchers will have to consult copies of original questionnaires archived at NARA to know original wording of questions and alternate responses.
Response Frequencies
Each survey has a file of response frequencies. This file presents the numbers and percentages of soldiers who responded in each category of each survey question, as well as each constructed (i.e., composite) variable.
This information is presented by variable name and is useful for those who want to know how soldiers responded to particular questions, or what the distribution of scores was for constructed variables, without having to run an analysis with the SPSS system file discussed above. Labels for these files are derived from the SPSS datasets and will reflect truncation.
Conclusion
Once again, the authoritative guides to understanding the data are the codebooks Roper produced for ARI in 1978. They have not only informed the transformation of the legacy electronic files in the creation of this digital repository, but they are also the only surviving documentation of the transfer of punch card data to electronic tapes.
The codebooks are imperfect creations themselves, based on the documents that accompanied the donation of punch cards to Roper. Users who encounter challenges interpreting these codebooks may wish to consult study folders available at NARA in College Park, MD. Those who wish to do so should know that while more information is available in the archived papers of the Research Branch and US Army Information & Education Division, those study folders are incomplete records, too, and for some surveys, study folders simply do not exist.
Finally, scholars could also consult the papers of Samuel A. Stouffer at Harvard University Archives, as well as a secondary collection, American Soldier in WWII subject index and codebooks, also archived at Harvard.
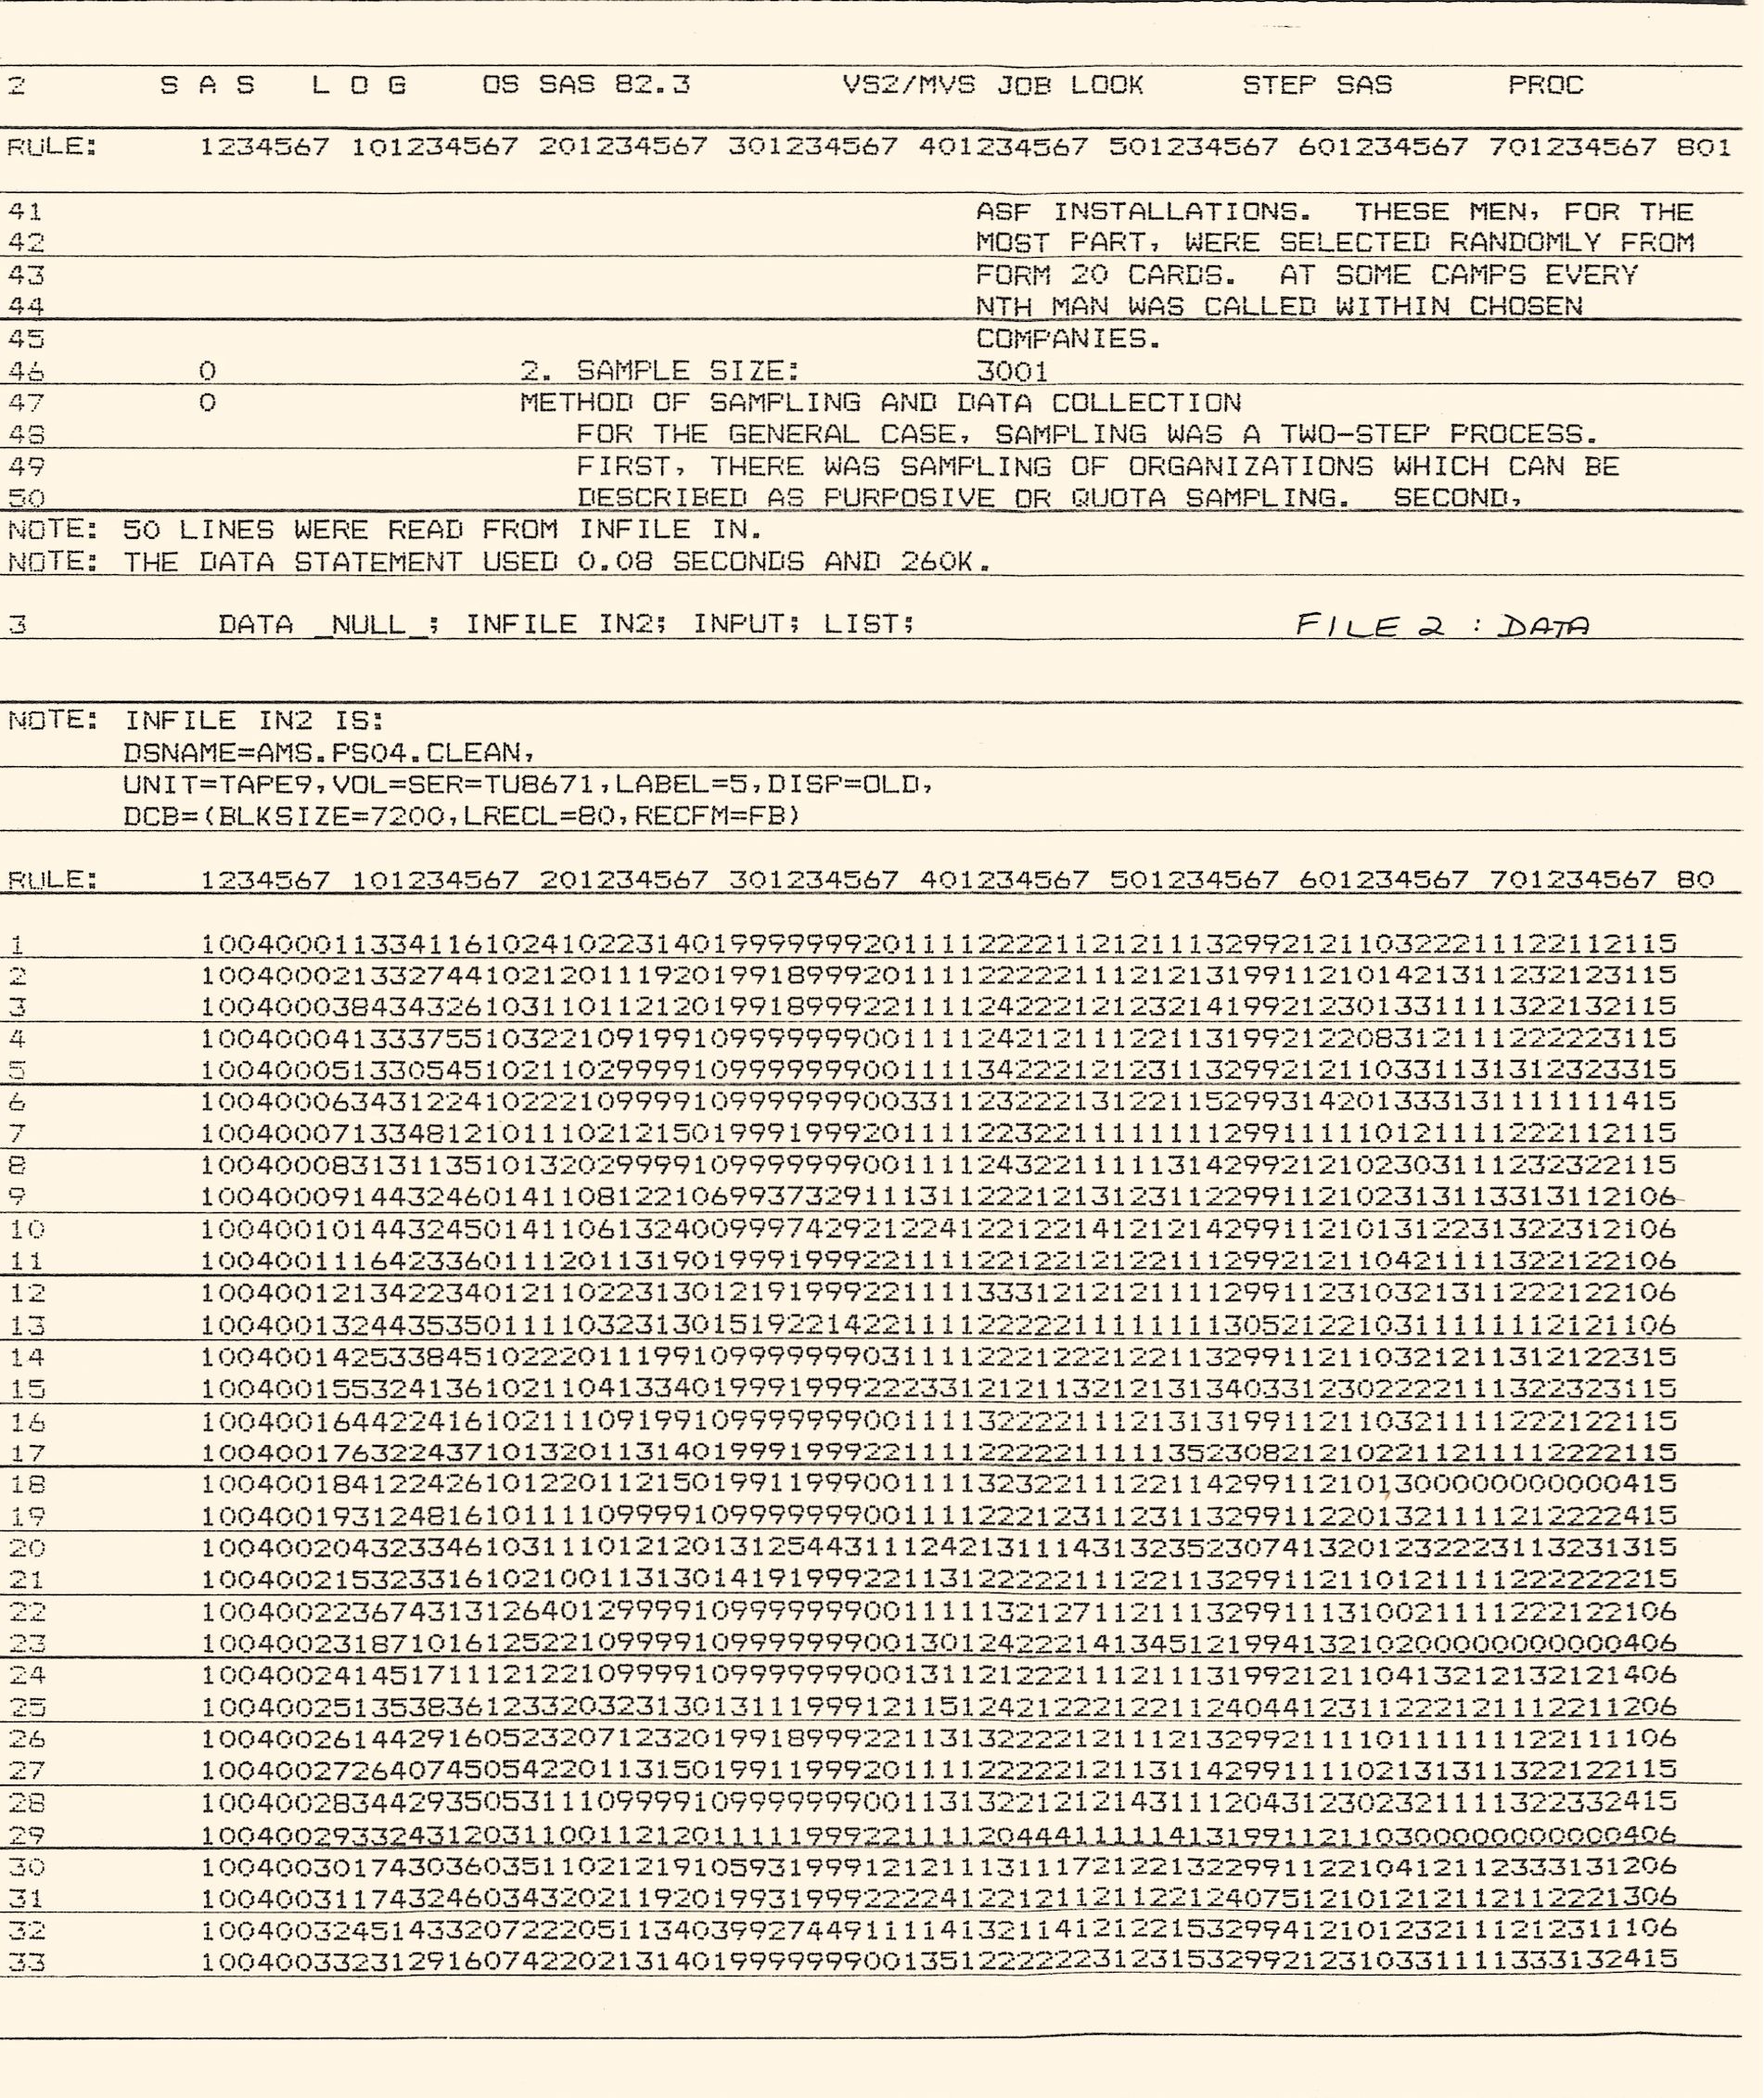
Partial computer printout of Planning Survey IV codebook along with associated data from tape, produced in 1986. Courtesy of John P. Hawkins, professor emeritus of anthropology at Brigham Young University.
COVER IMAGE: “T/3 Richard Kenefic, from 268 West Fourth St., Oswego, N.Y. Works at an International Business Machine in the Attitude Research Section of the Headquarters in Budingen, Germany...,” 18 May 1948. Print 111-SC-301394, box 611, Office of the Chief Signal Officer, RG 111-SC, NARA.